Copyright
©The Author(s) 2024.
World J Gastrointest Oncol. Feb 15, 2024; 16(2): 557-562
Published online Feb 15, 2024. doi: 10.4251/wjgo.v16.i2.557
Published online Feb 15, 2024. doi: 10.4251/wjgo.v16.i2.557
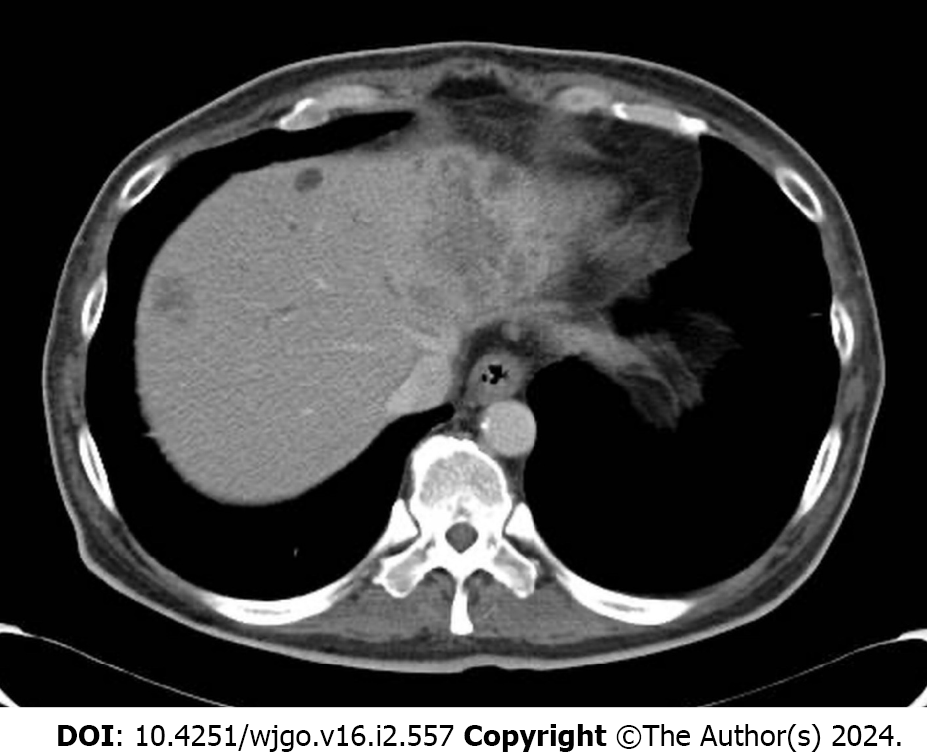
Figure 1 Image of hepatic metastases on admission.
Contrast-enhanced computed tomography scan showing multiple hepatic masses.
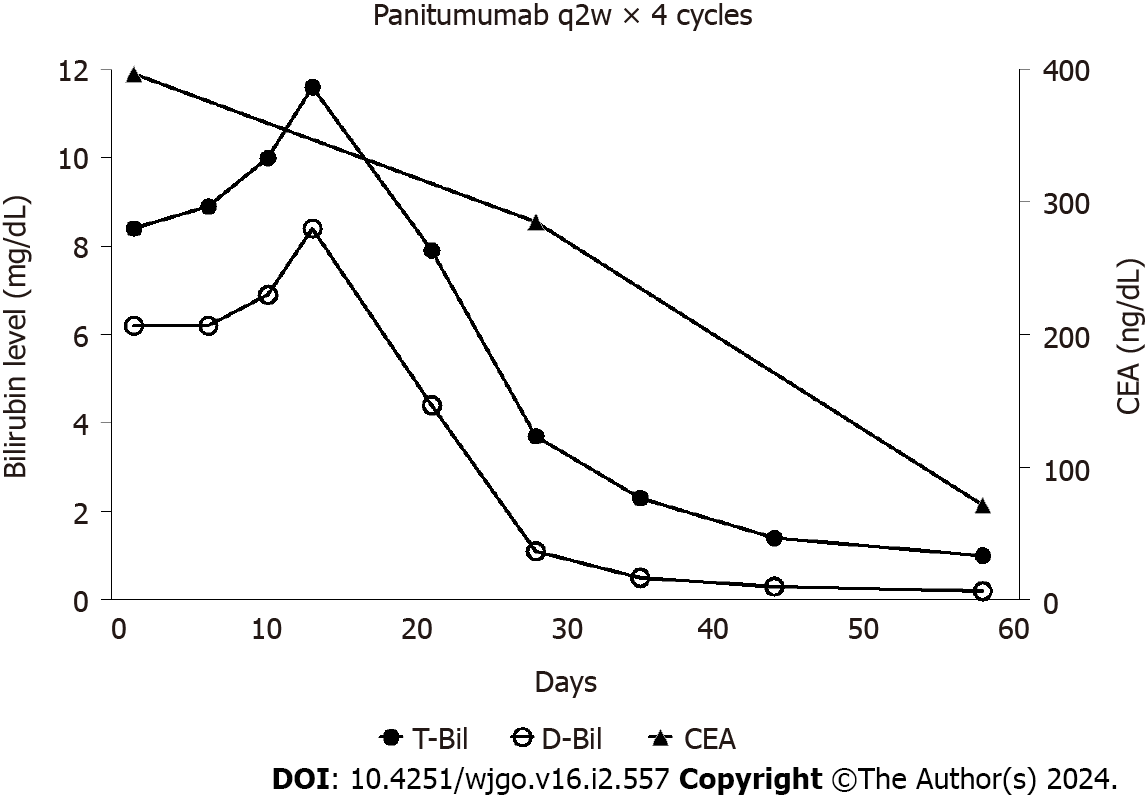
Figure 2 Clinical course of the patient.
Bilirubin and carcinoembryonic antigen levels markedly decreased after four cycles of panitumumab monotherapy. CEA: Carcinoembryonic antigen.
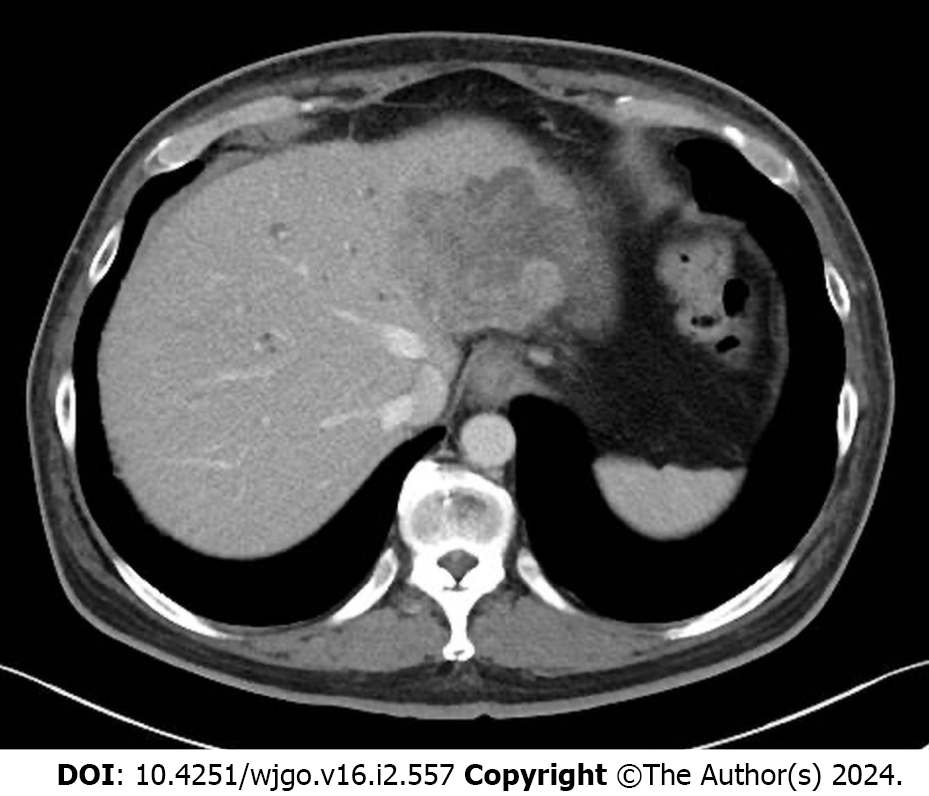
Figure 3 Image of hepatic metastases after 4 cycles of panitumumab monotherapy.
Contrast-enhanced computed tomography revealed decreased sizes of the hepatic masses.
- Citation: Tsurui T, Hirasawa Y, Kubota Y, Yoshimura K, Tsunoda T. Anti-EGFR antibody monotherapy for colorectal cancer with severe hyperbilirubinemia: A case report. World J Gastrointest Oncol 2024; 16(2): 557-562
- URL: https://www.wjgnet.com/1948-5204/full/v16/i2/557.htm
- DOI: https://dx.doi.org/10.4251/wjgo.v16.i2.557


