Copyright
©The Author(s) 2023.
World J Gastrointest Oncol. Jan 15, 2023; 15(1): 155-170
Published online Jan 15, 2023. doi: 10.4251/wjgo.v15.i1.155
Published online Jan 15, 2023. doi: 10.4251/wjgo.v15.i1.155
Figure 1 Flow chart of study enrollment and exclusions.
SEER: Surveillance, Epidemiology, and End Results; PDAC: Pancreatic ductal adenocarcinoma; ICD-O-3: International Classification of Diseases for Oncology, Third Edition; RT: Radiation therapy.
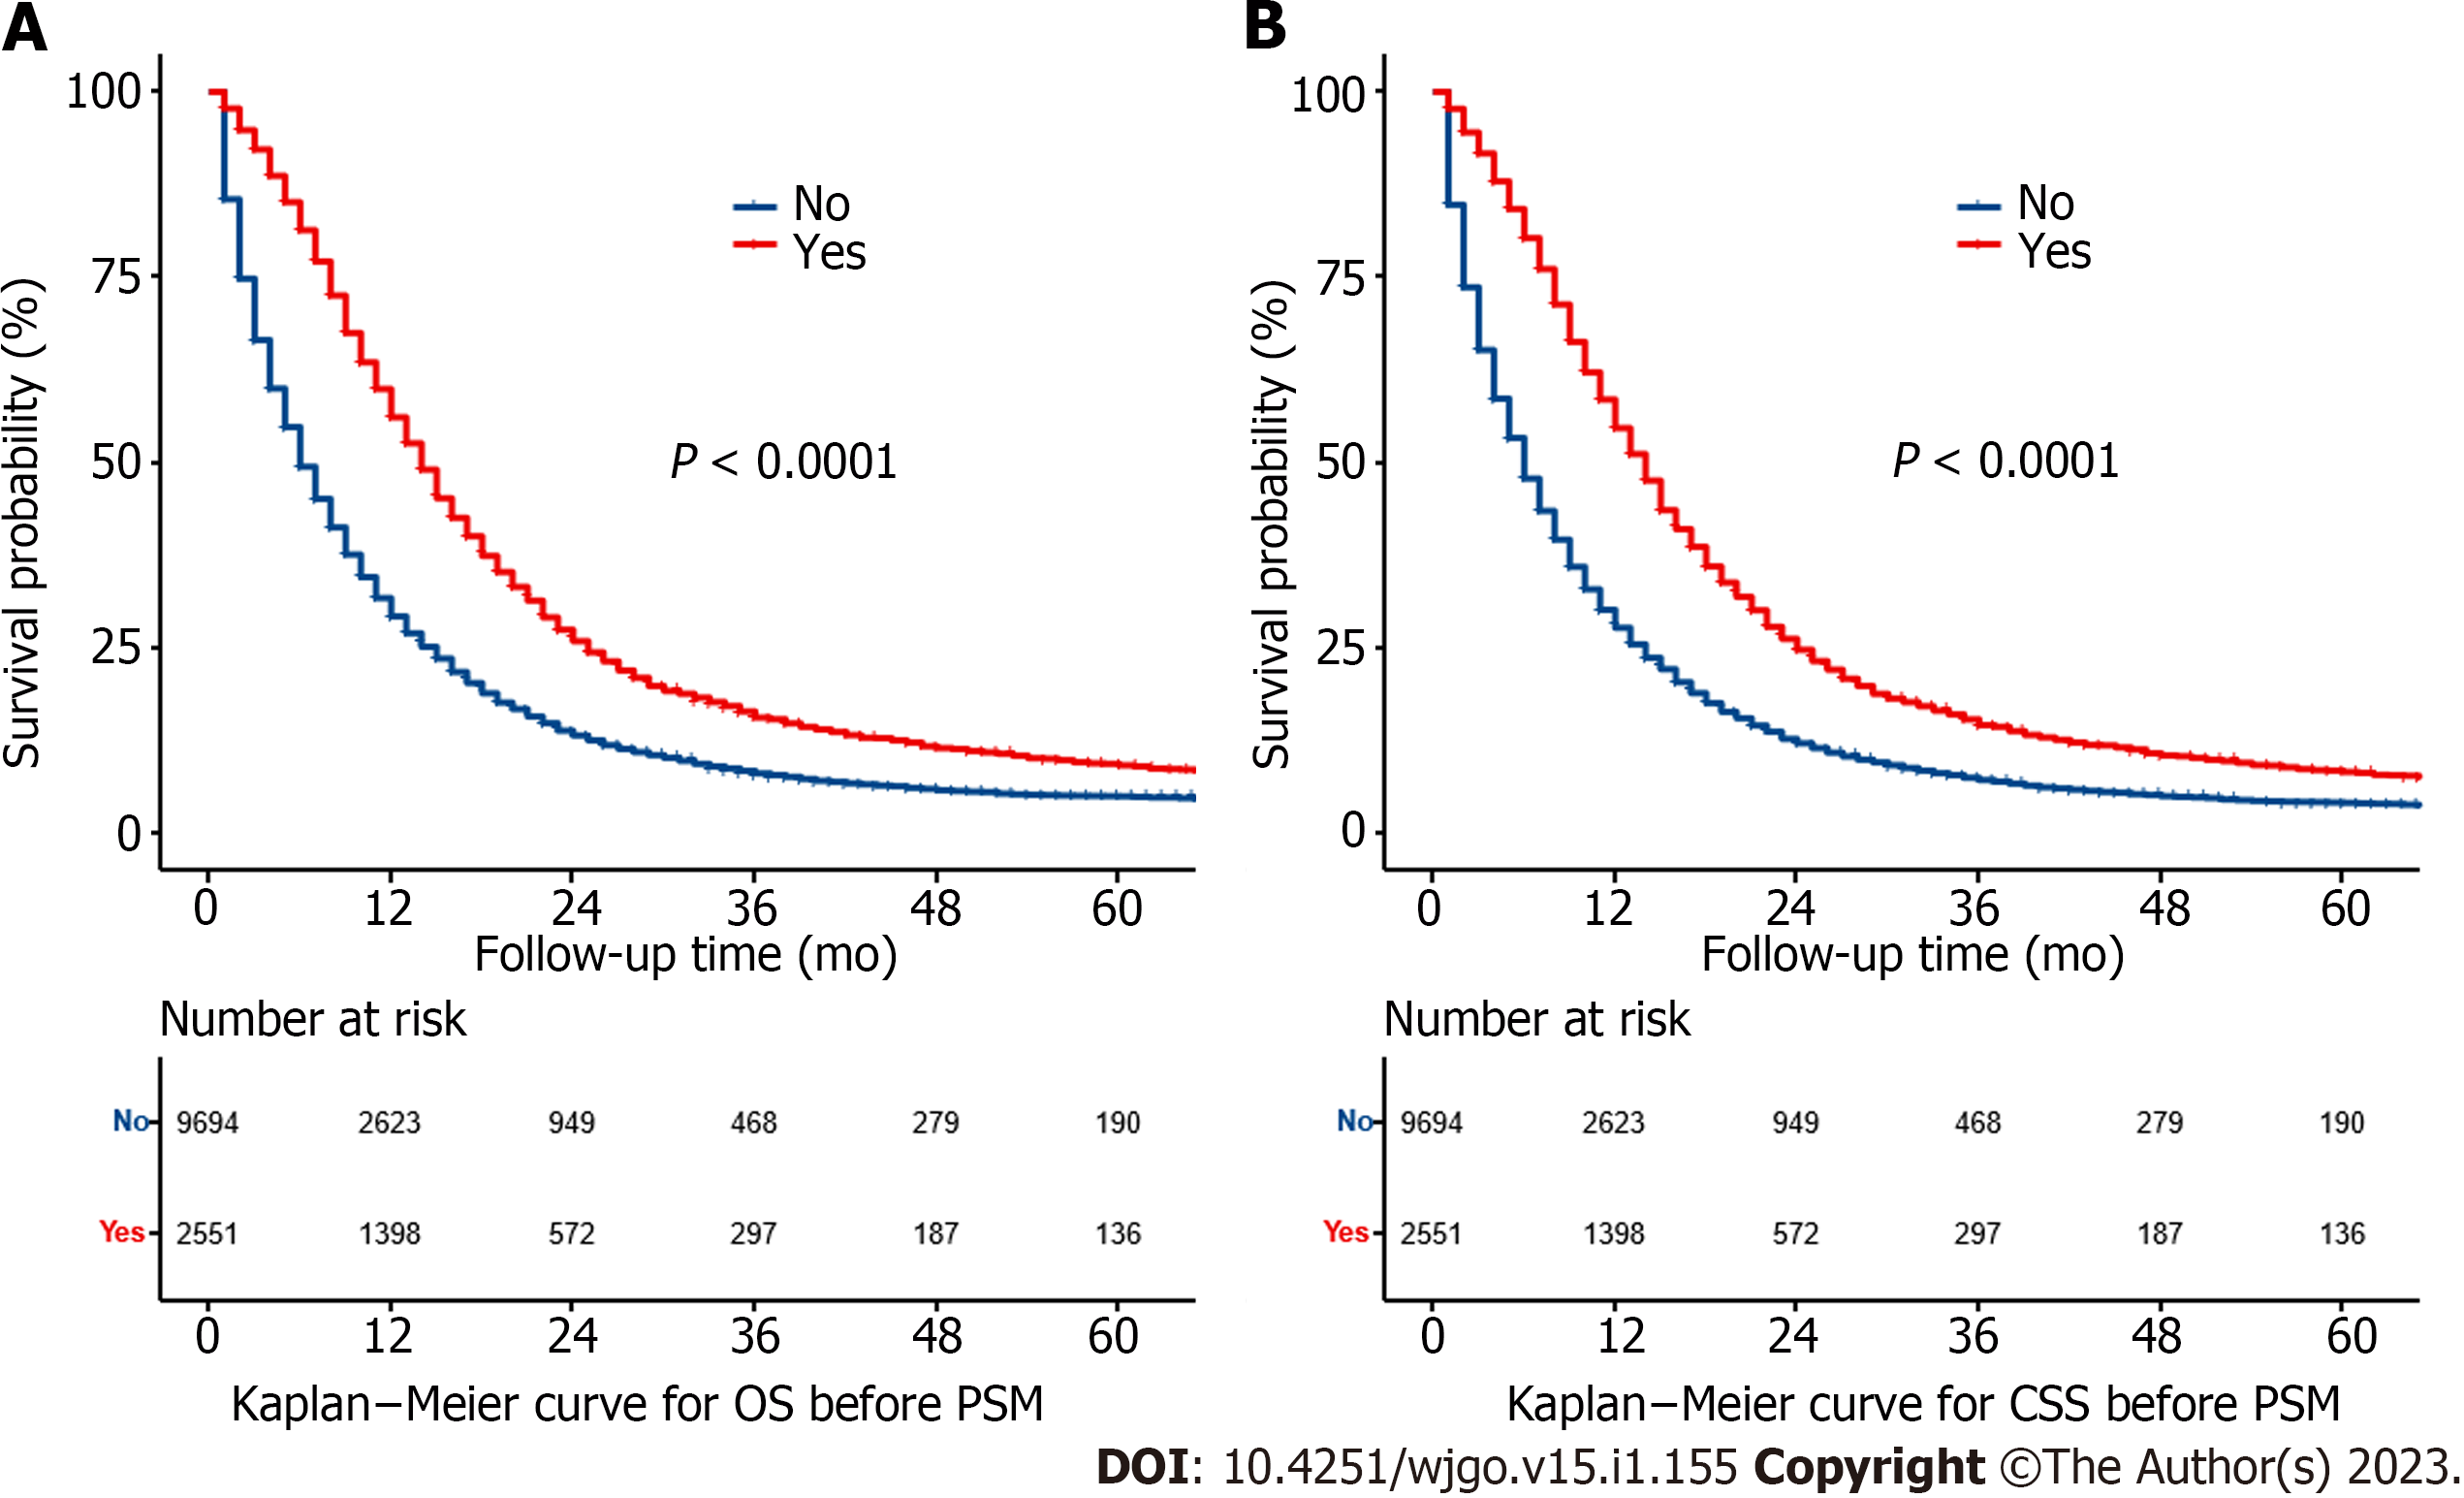
Figure 2 Kaplan–Meier curves for overall survival and cancer-specific survival of radiation therapy in elderly patients with pancreatic ductal adenocarcinoma before propensity score matching.
A: Kaplan–Meier curve of overall survival; B: Kaplan–Meier curve of cancer-specific survival; OS: Overall survival; CSS: Cancer-specific survival; PSM: Propensity score matching.
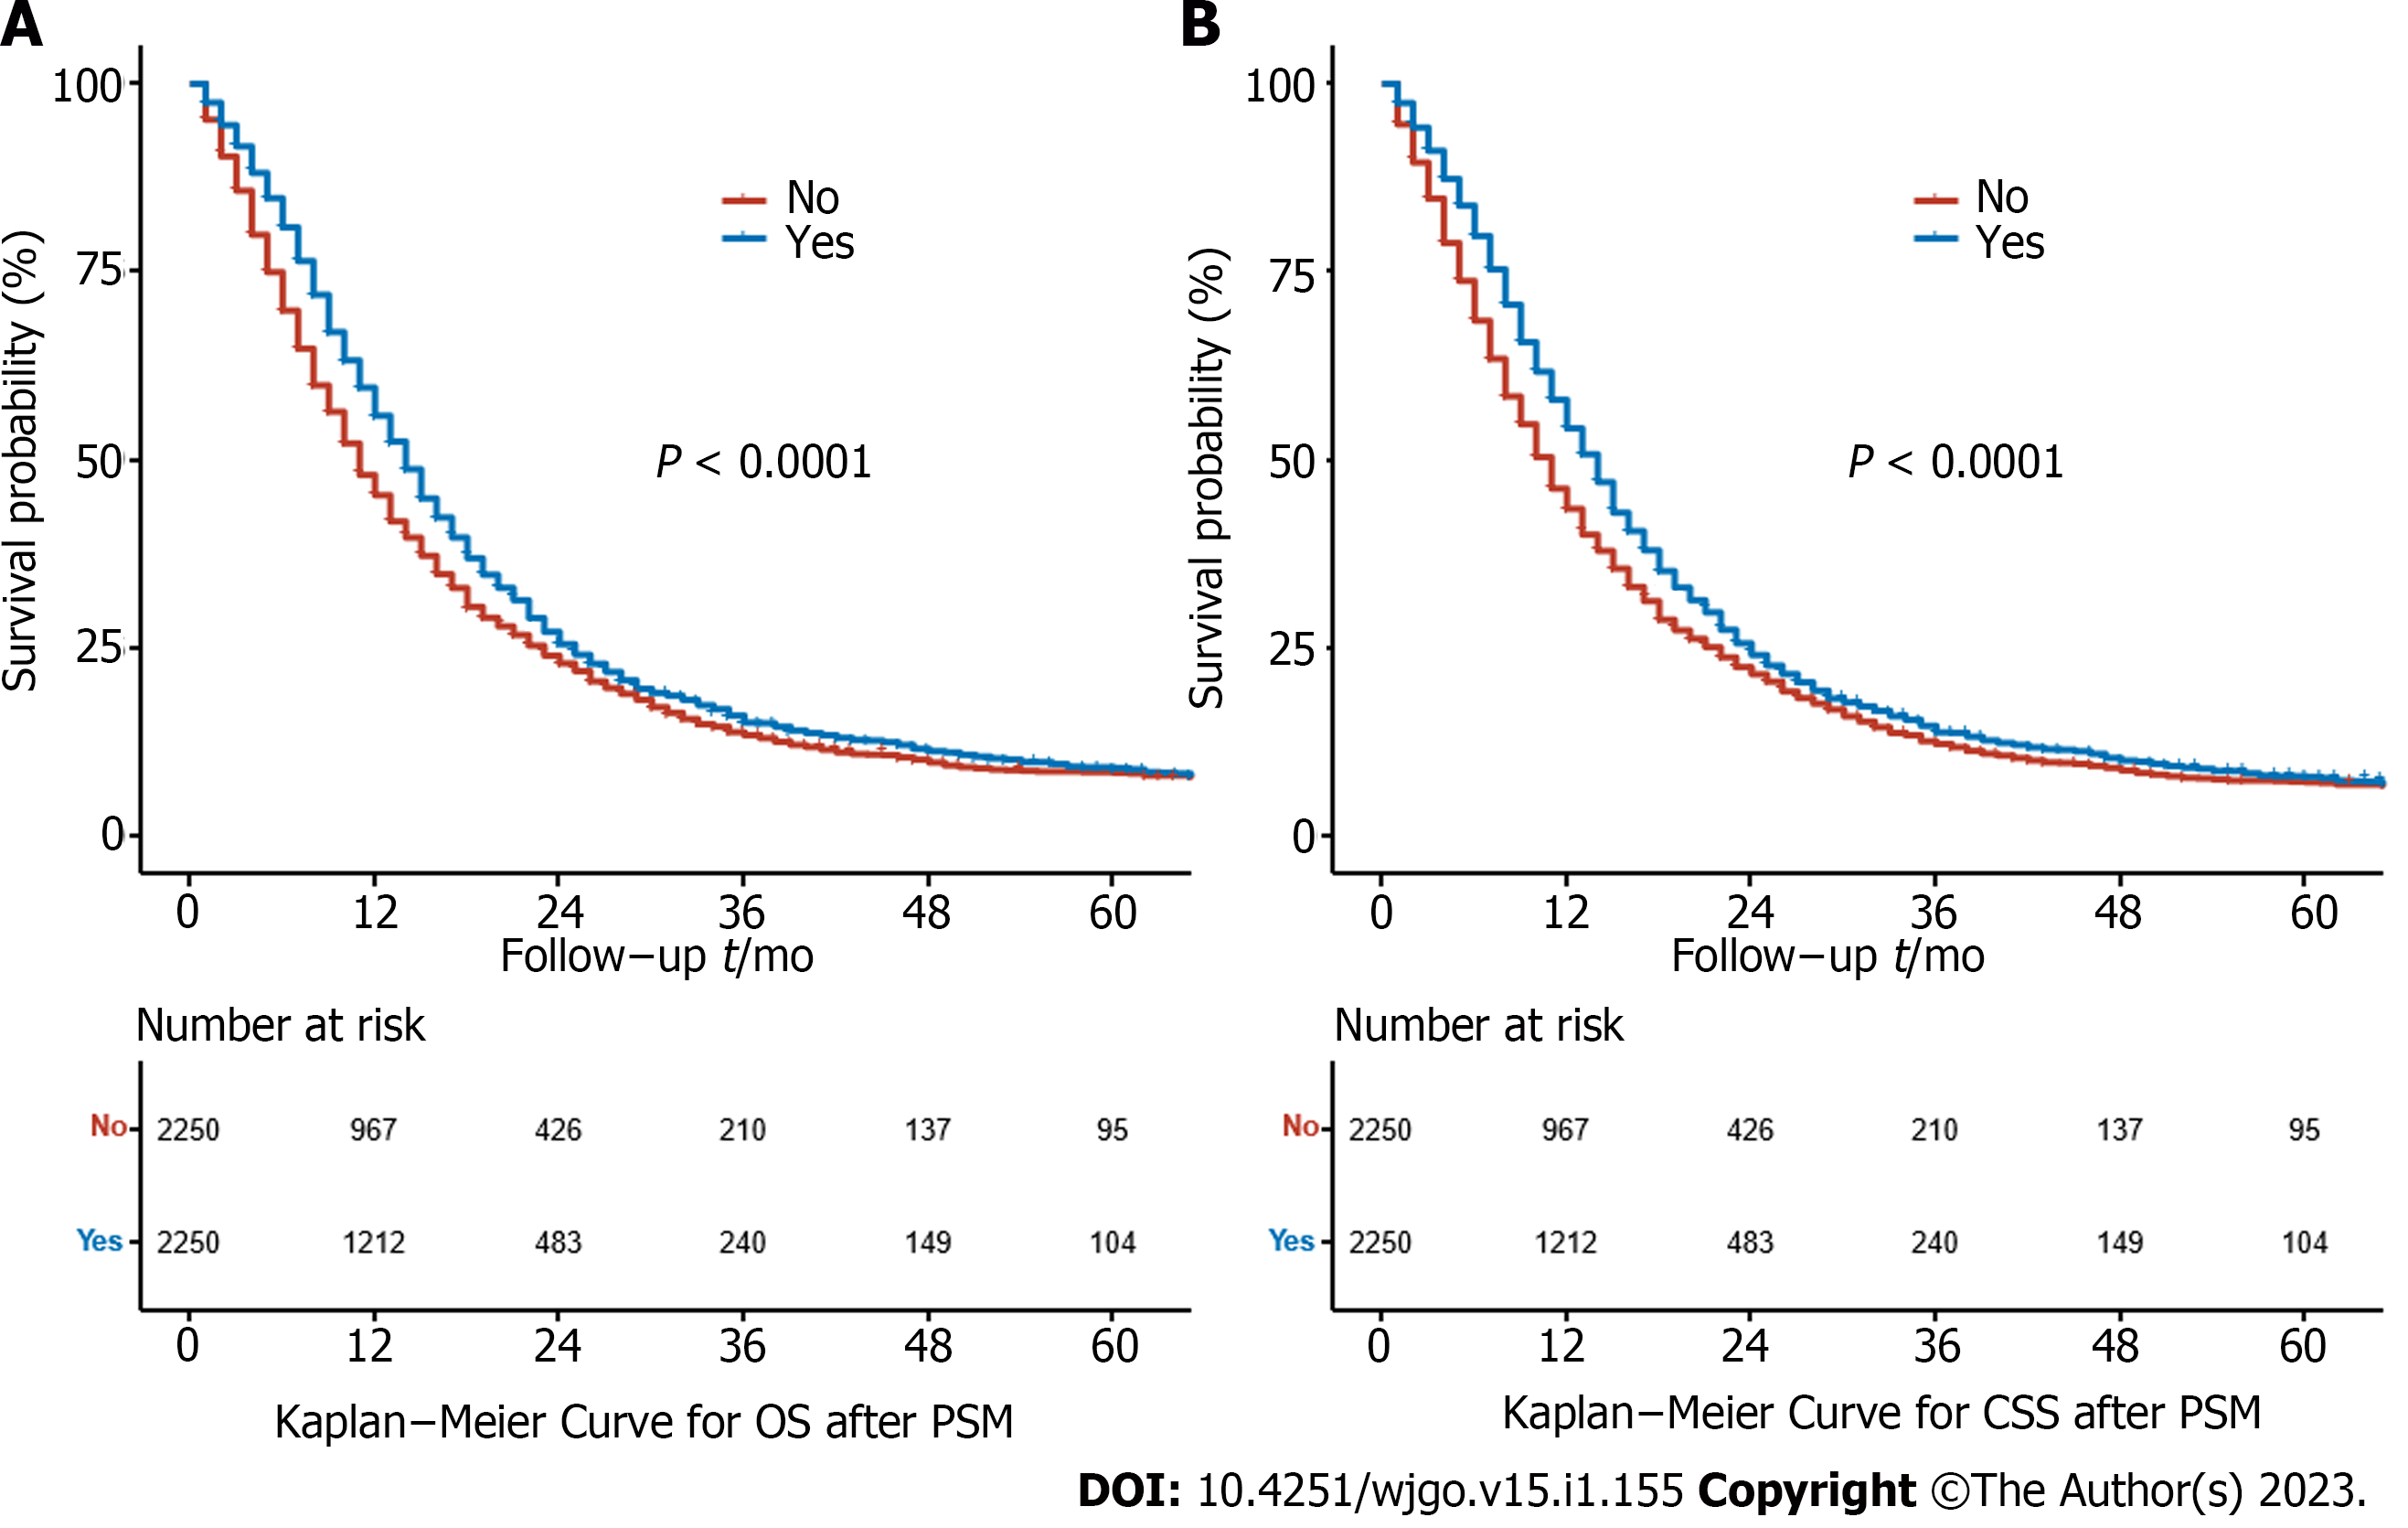
Figure 3 Kaplan–Meier curves for overall survival and cancer-specific survival of radiation therapy in elderly patients with pancreatic ductal adenocarcinoma after propensity score matching.
A: Kaplan–Meier curve of overall survival; B: Kaplan–Meier curve of cancer-specific survival; OS: Overall survival; CSS: Cancer-specific survival; PSM: Propensity score matching.
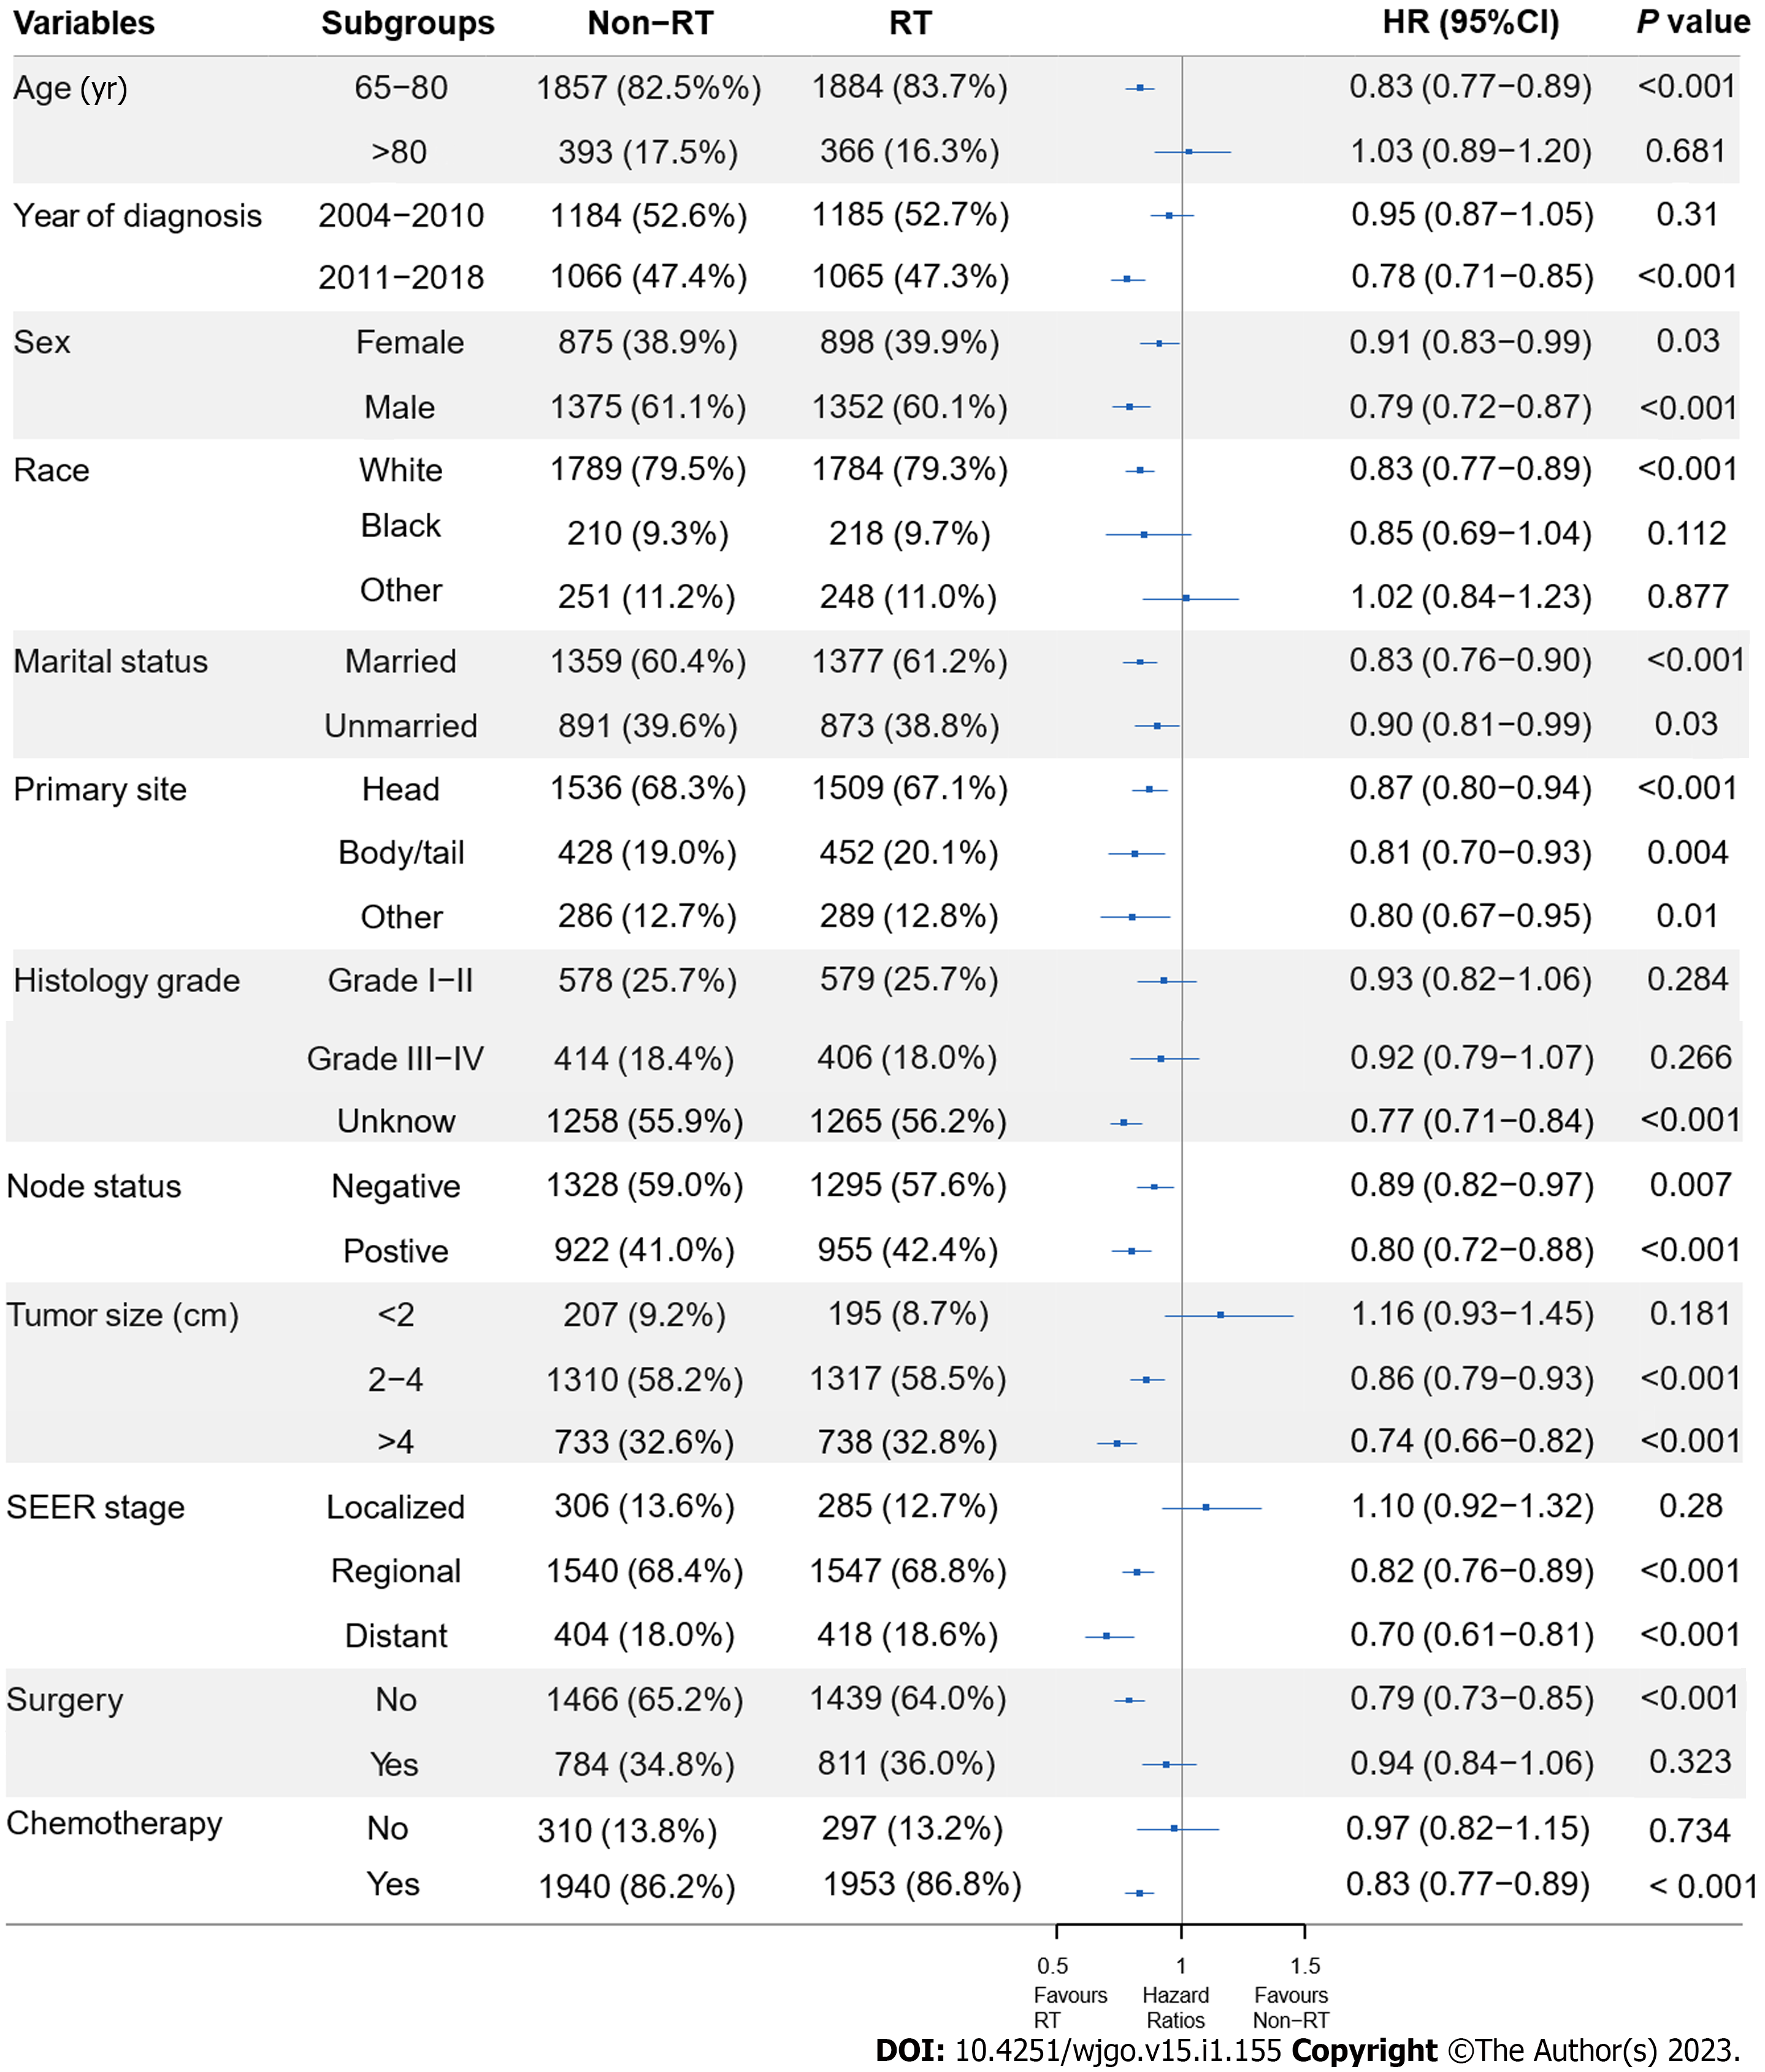
Figure 4 Subgroup analysis of radiation therapy or non-radiation therapy for overall survival in elderly patients with pancreatic ductal adenocarcinoma after propensity score matching.
SEER: Surveillance, Epidemiology, and End Results; HR: Hazard ratio; RT: Radiation therapy; CI: Confidence interval.
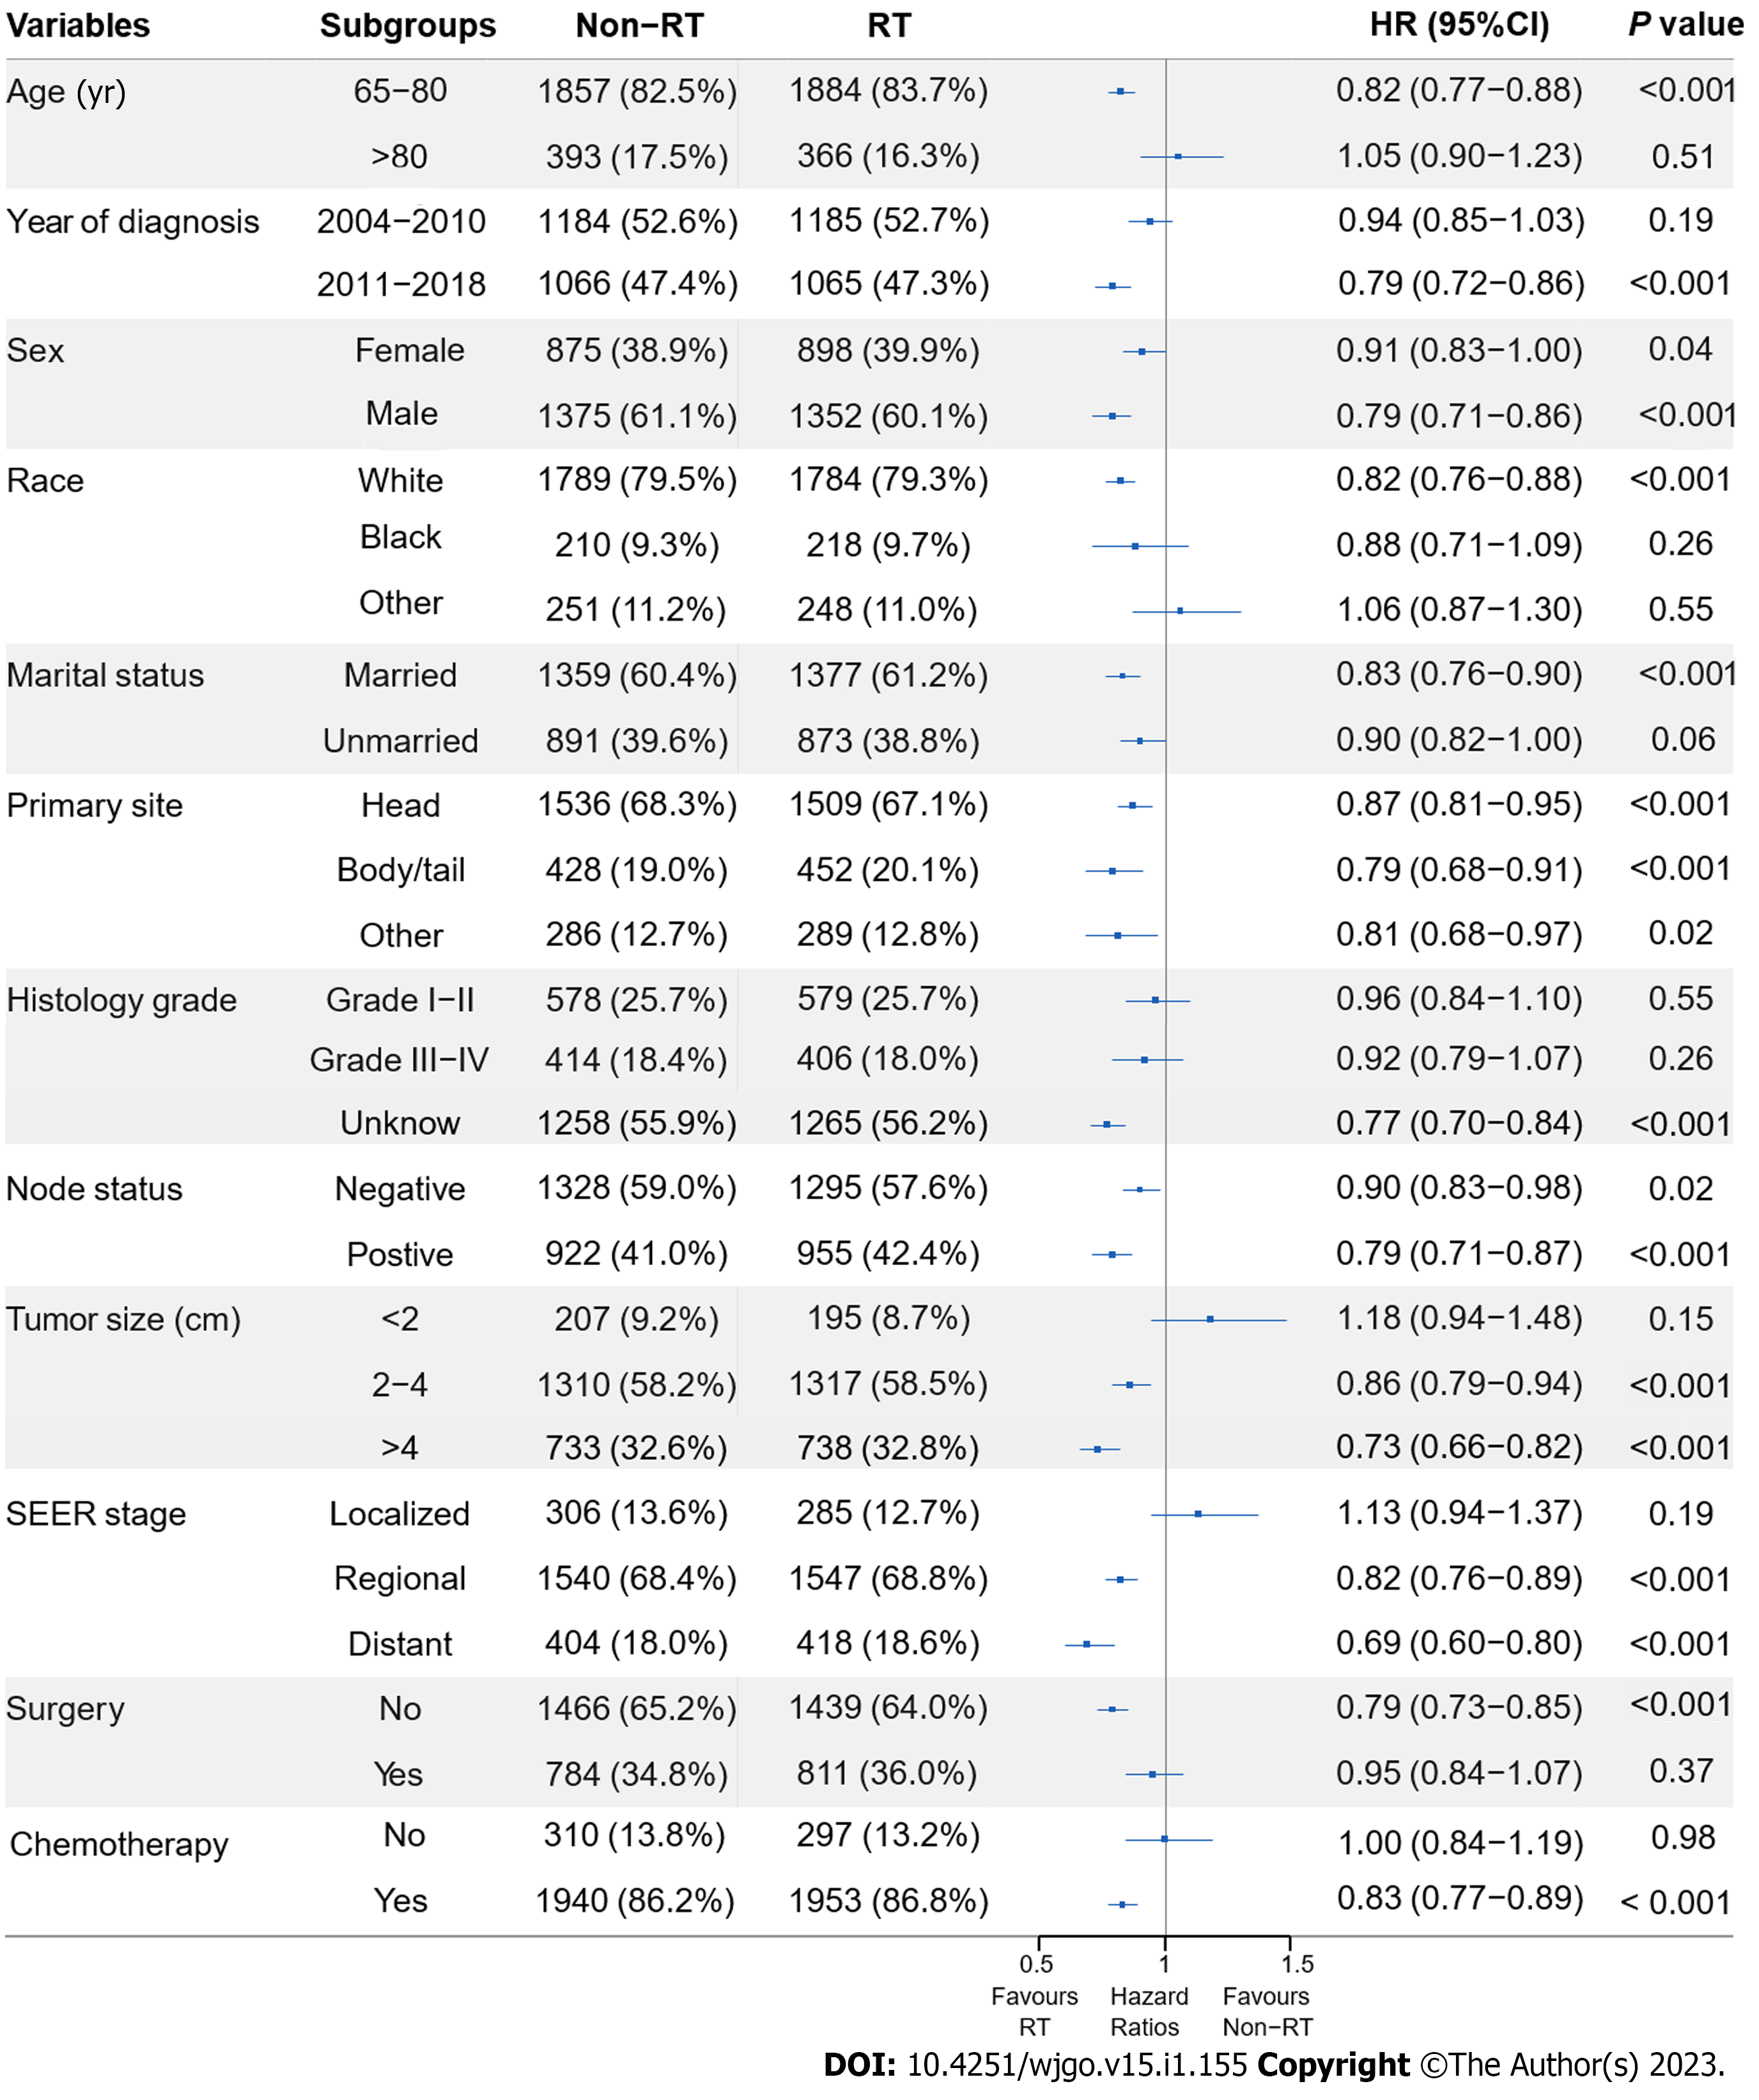
Figure 5 Subgroup analysis of radiation therapy or non-radiation therapy for cancer-specific survival in elderly patients with pancreatic ductal adenocarcinoma after propensity score matching.
SEER: Surveillance, Epidemiology, and End Results; HR: Hazard ratio; RT: Radiation therapy; CI: Confidence interval.
- Citation: Cao BY, Wang QQ, Zhang LT, Wu CC, Tong F, Yang W, Wang J. Survival benefits and disparities in radiation therapy for elderly patients with pancreatic ductal adenocarcinoma. World J Gastrointest Oncol 2023; 15(1): 155-170
- URL: https://www.wjgnet.com/1948-5204/full/v15/i1/155.htm
- DOI: https://dx.doi.org/10.4251/wjgo.v15.i1.155


