Copyright
©The Author(s) 2022.
World J Gastrointest Oncol. Oct 15, 2022; 14(10): 1933-1948
Published online Oct 15, 2022. doi: 10.4251/wjgo.v14.i10.1933
Published online Oct 15, 2022. doi: 10.4251/wjgo.v14.i10.1933
Figure 1 Experimental design of the study.
HCC: Hepatocellular carcinoma; TCGA: The Cancer Genome Atlas; FC: Fold change; FDR: False discovery rate; GO: Gene Ontology; KEEG: Kyoto Encyclopedia of Genes and Genomes; TMB: Tumor mutation burden; PD-1: Programmed cell death protein 1; CTLA4: Cytotoxic T lymphocyte-associated antigen-4.
Figure 2 VCAN mRNA expression in tumor tissue and adjacent tissue in The Cancer Genome Atlas Liver Hepatocellular Carcinoma.
A: VCAN mRNA expression in different types of tumors; B: VCAN mRNA expression in 374 tumor tissues and 50 normal tissues from The Cancer Genome Atlas Liver Hepatocellular Carcinoma (TCGA-LIHC); C: VCAN mRNA expression in 50 paired tumor tissues and normal tissues from TCGA-LIHC; D: Kaplan-Meier analysis for low VCAN and high VCAN expression (median as cutoff) in TCGA-LIHC. aP < 0.05, bP < 0.01, cP < 0.001. TPM: Transcripts per kilobase of exon model per million mapped reads; HR: Hazard ratio.
Figure 3 Univariate and multivariate Cox regression forest plots of The Cancer Genome Atlas Liver Hepatocellular Carcinoma.
HR: Hazard ratio; CI: Confidence interval.
Figure 4 Expression of VCAN mRNA and DNA methylation in patients with hepatitis B virus-related hepatocellular carcinoma and cirrhosis.
A: VCAN mRNA expression in the serum of hepatitis B virus (HBV)-related patients and controls; B: VCAN DNA methylation in the blood of HBV-related patients; C: Box diagram of VCAN CpG methylation in HBV-related patients; D: Correlation heatmap between VCAN mRNA and the methylation of each CpG site in blood. ns: P > 0.05, aP < 0.05. HCC: Hepatocellular carcinoma.
Figure 5 Immunohistochemical staining for VCAN in tumor tissue and adjacent tissue.
A: Immunohistochemical results of VCAN in normal liver tissue and liver tumor tissue in the Human Protein Atlas; B: Immunohistochemical results of VCAN in liver tumor tissue and tumor-adjacent tissue from patients.
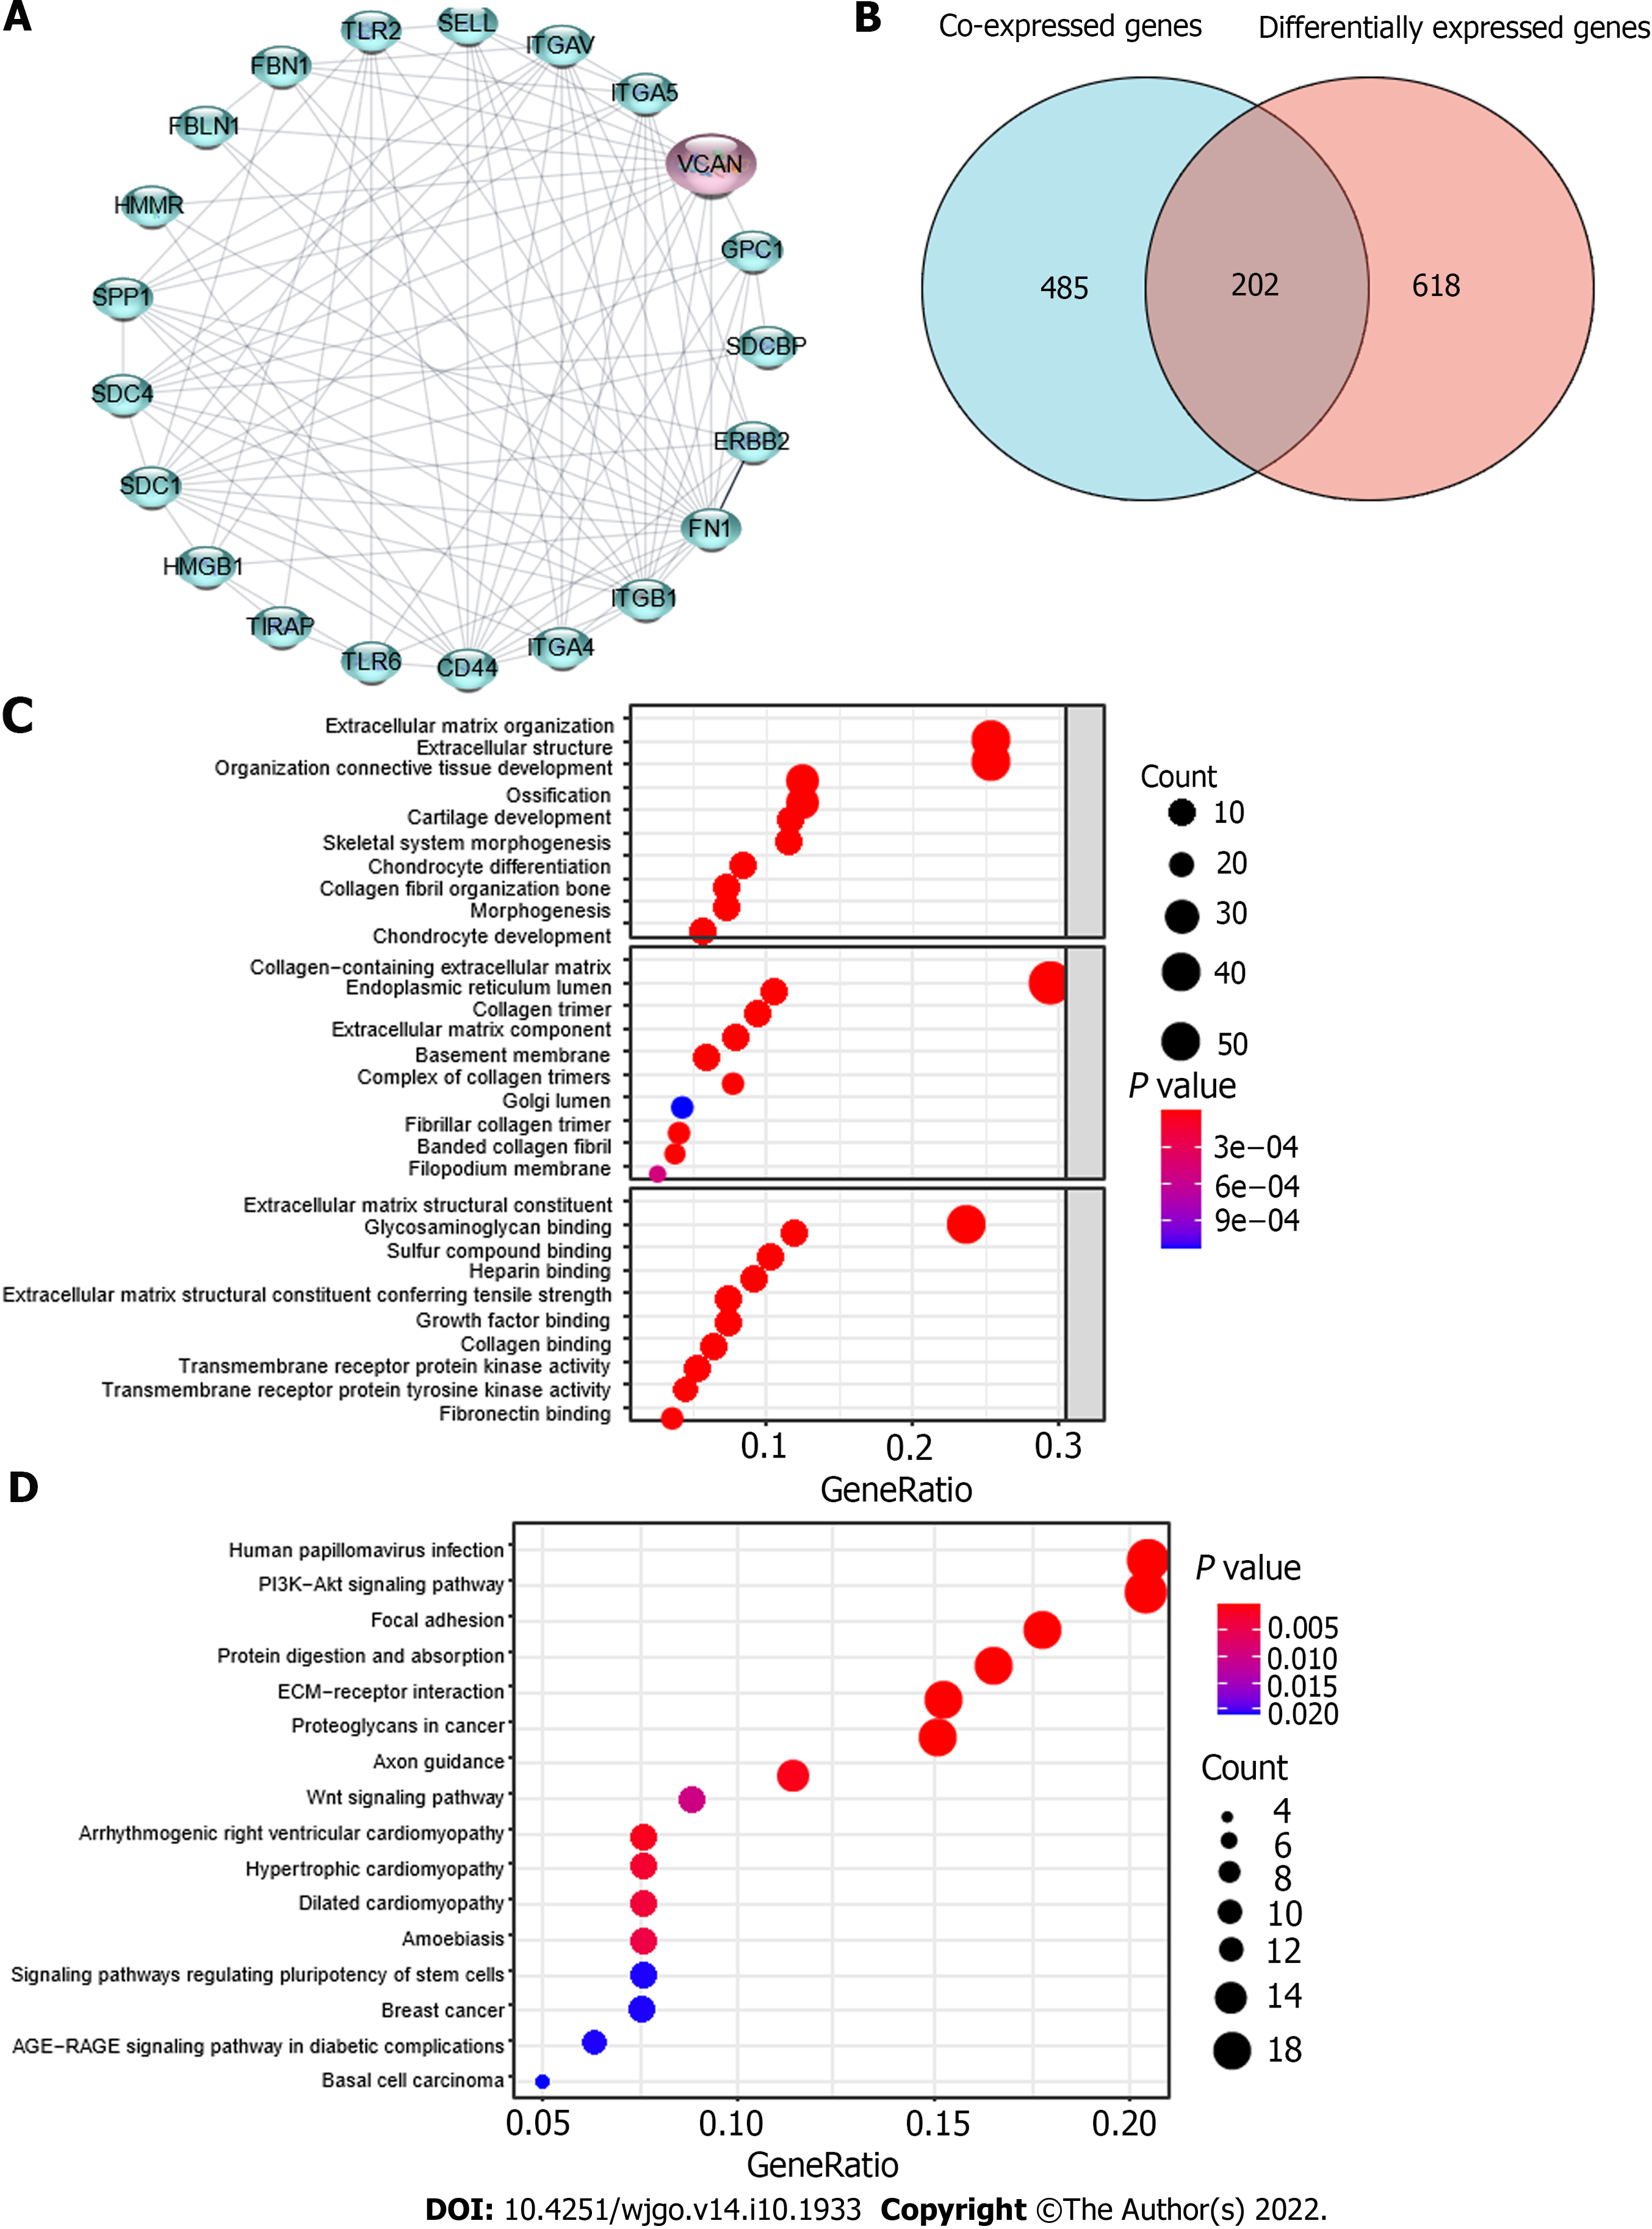
Figure 6 Possible mechanism of action of VCAN in hepatocellular carcinoma.
A: Protein-protein interaction analysis of VCAN on STRING; B: Venn diagram for VCAN co-expressed genes and differentially expressed genes in high VCAN group and low VCAN group; C: Gene Ontology analysis of the 202 intersection genes; D: Kyoto Encyclopedia of Genes and Genomes analysis of the 202 intersection genes. HMMR: Hyaluronan mediated motility receptor; FBLN1: Fibulin-1; FBN1: Fibrillin-1; TLR2: Toll-like receptor 2; SELL: L-selectin; ITGAV: Integrin alpha-V; ITGA5: Integrin alpha-5; GPC1: Glypican-1; SDCBP: Syntenin-1; ERBB2: Receptor tyrosine-protein kinase erbB-2; FN1: Fibronectin 1; ITGB1: Integrin beta-1; ITGA4: Integrin alpha-4; CD44: CD44 antigen; TIRAP: Toll/interleukin-1 receptor domain-containing adapter protein; HMGB1: High mobility group protein B1; SDC: Syndecan; SPP1: Secreted phosphoprotein 1.
Figure 7 Immune cell infiltration in low VCAN group and high VCAN group.
A: Immune cell infiltration calculated by ssGSEA algorithm; B: Immune cell infiltration calculated by CIBERSORTx algorithm; C: Immune cell infiltration calculated by TIMER algorithm. ns: P > 0.05; aP < 0.05, bP < 0.01, cP < 0.001.
Figure 8 Correlation between VCAN and tumor microenvironment score, tumor mutation burden, or immune checkpoint genes.
A: Tumor purity of low VCAN group and high VCAN group; B: Stromal score, immune score, and ESTIMATE score of low VCAN group and high VCAN group; C: Significant VCAN-related immune checkpoint genes (r > 0.3, P < 0.05); D: Tumor mutation burden of low VCAN group and high VCAN group; E: Correlation between VCAN and programmed cell death protein 1/cytotoxic T lymphocyte antigen 4. cP < 0.001. TME: Tumor microenvironment.
- Citation: Wang MQ, Li YP, Xu M, Tian Y, Wu Y, Zhang X, Shi JJ, Dang SS, Jia XL. VCAN, expressed highly in hepatitis B virus-induced hepatocellular carcinoma, is a potential biomarker for immune checkpoint inhibitors. World J Gastrointest Oncol 2022; 14(10): 1933-1948
- URL: https://www.wjgnet.com/1948-5204/full/v14/i10/1933.htm
- DOI: https://dx.doi.org/10.4251/wjgo.v14.i10.1933


