Copyright
©The Author(s) 2020.
World J Gastrointest Oncol. Sep 15, 2020; 12(9): 975-991
Published online Sep 15, 2020. doi: 10.4251/wjgo.v12.i9.975
Published online Sep 15, 2020. doi: 10.4251/wjgo.v12.i9.975
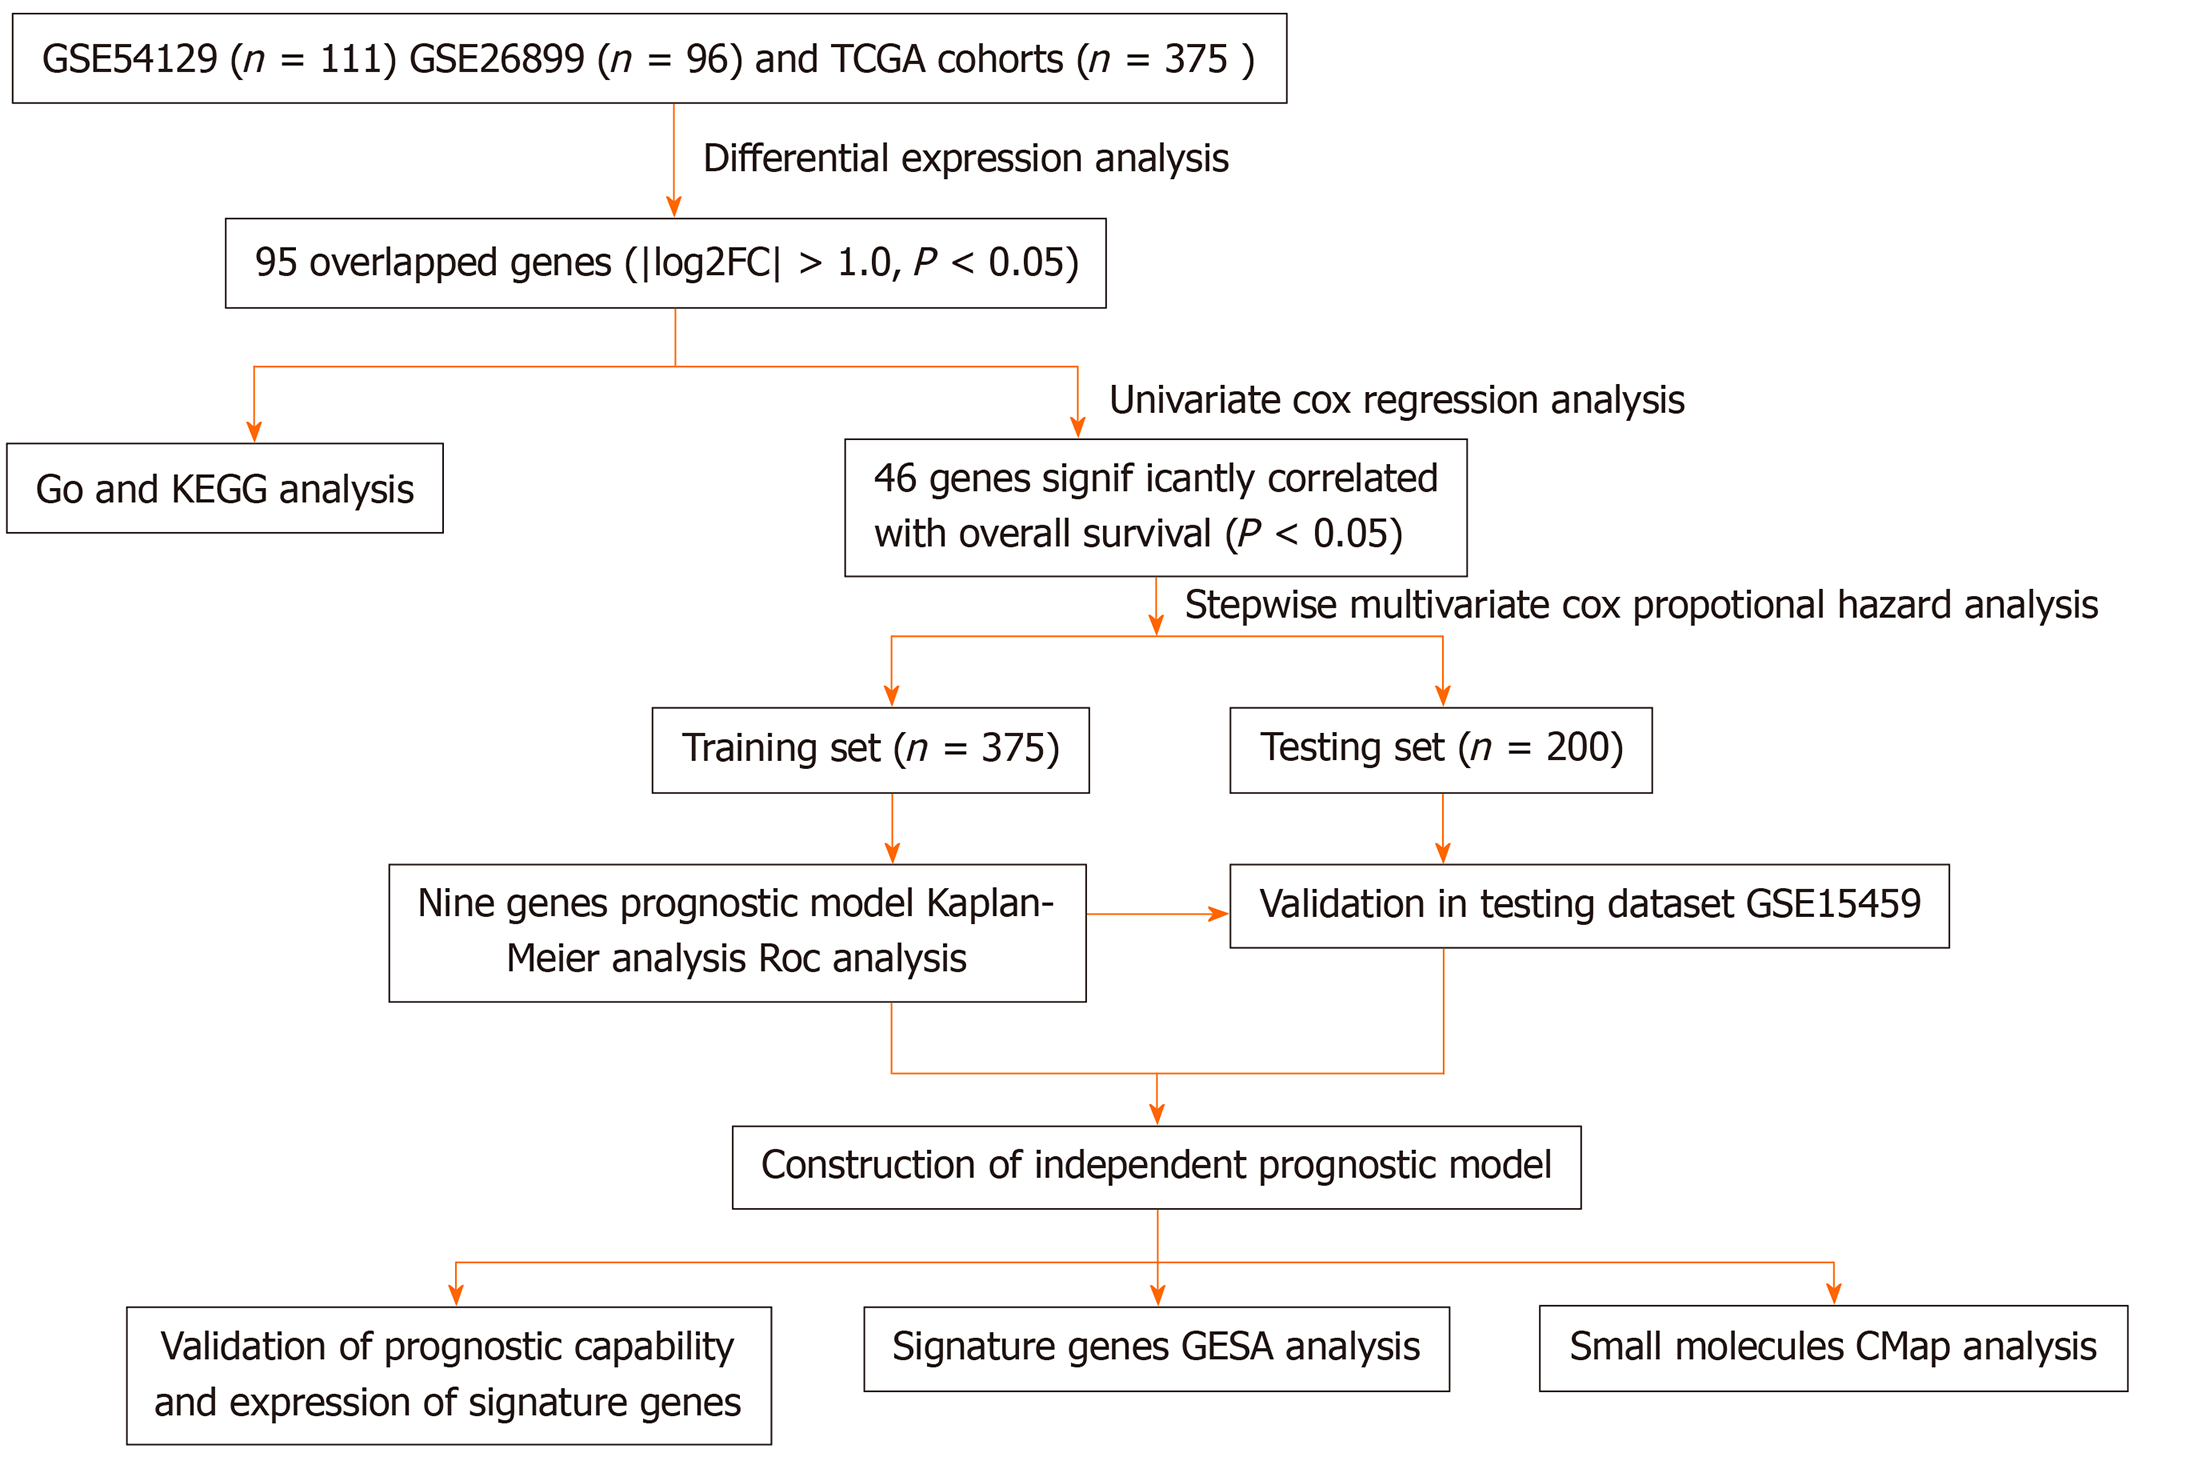
Figure 1 Flow diagram showing study scheme and main procedures.
Figure formula 1
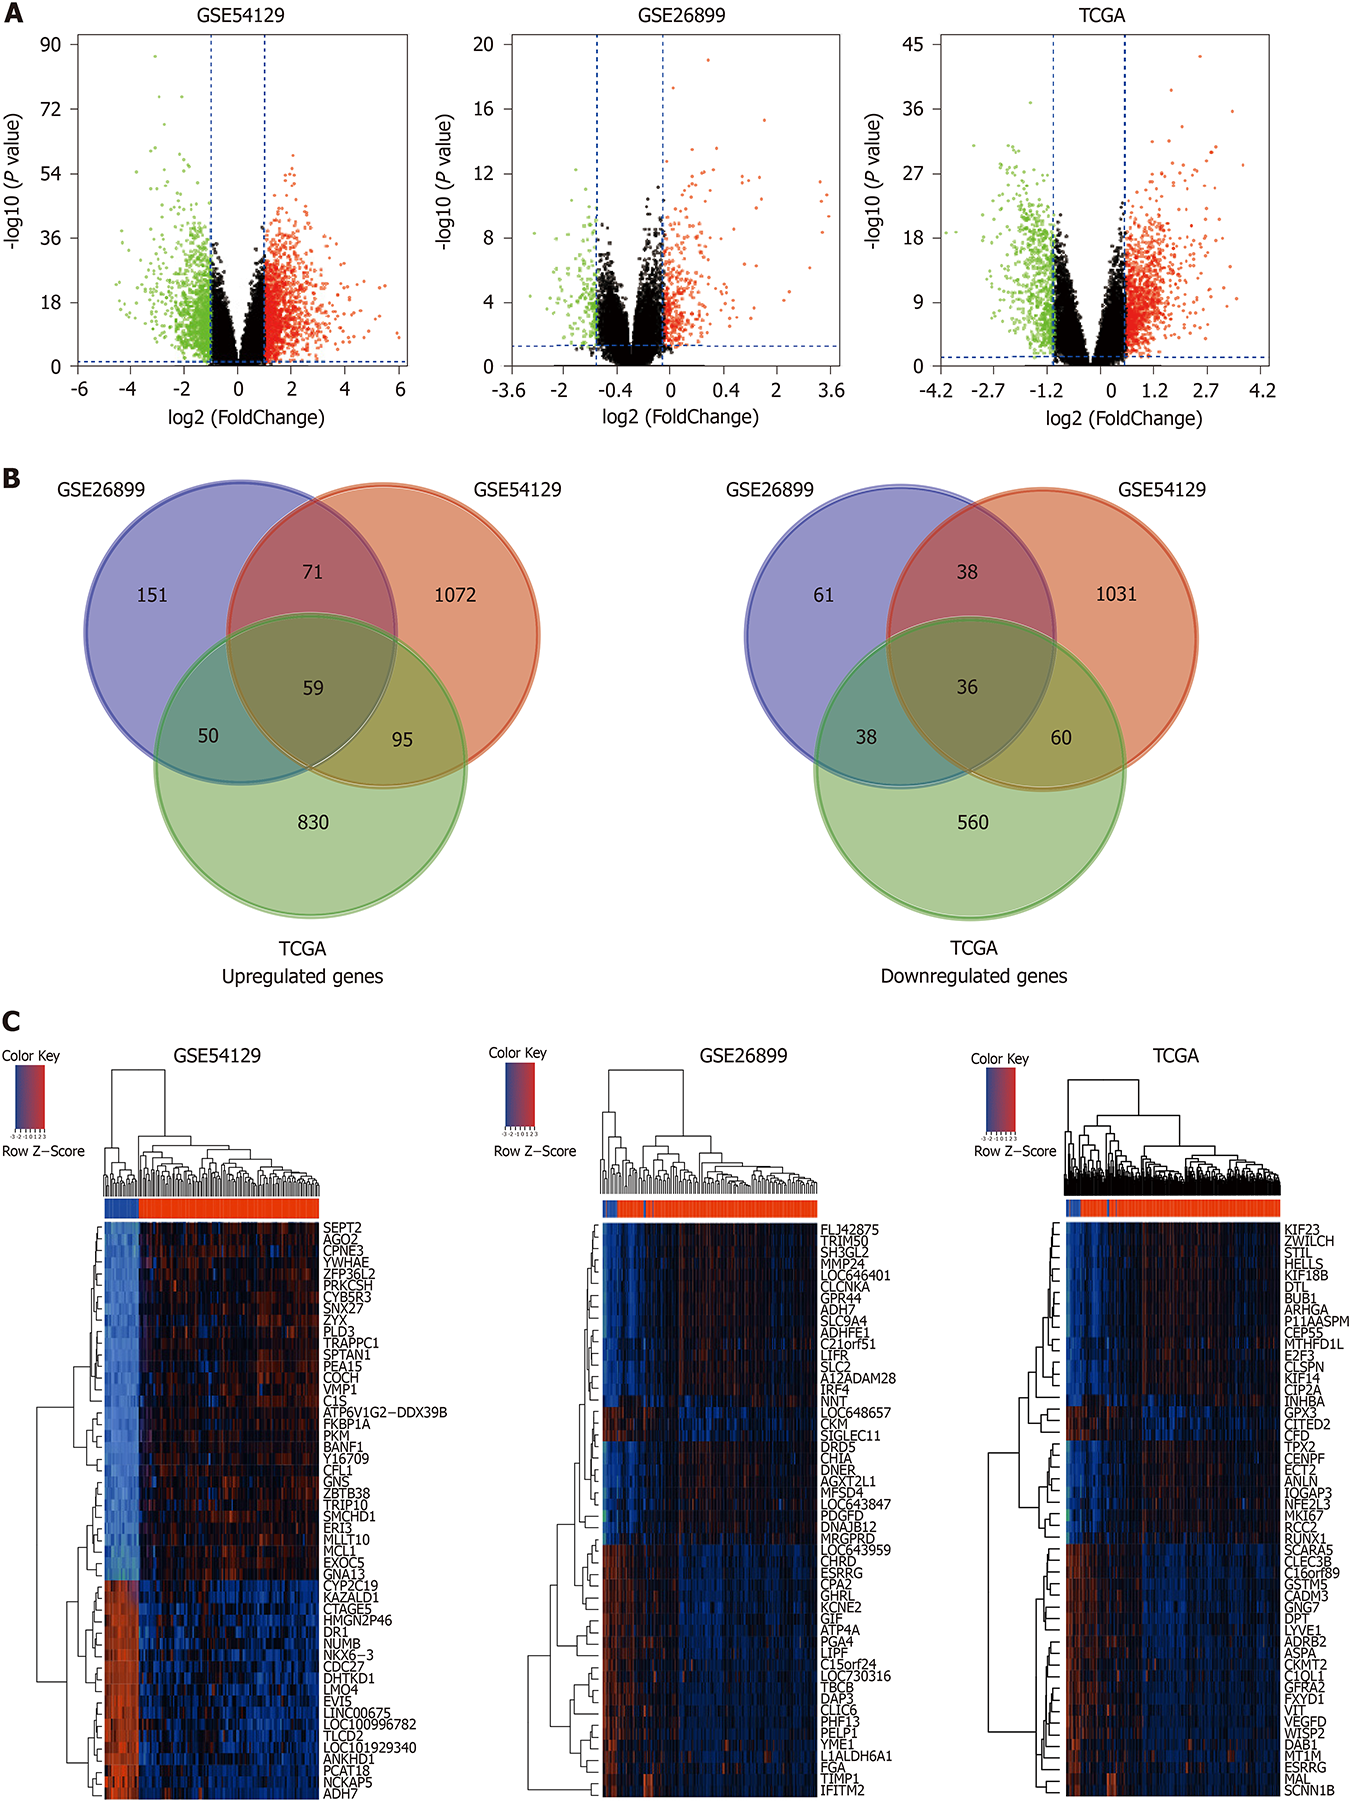
Figure 2 Differentially expressed genes between gastric carcinoma and normal gastric tissues.
A: Volcano plots visualizing the differentially expressed genes (DEGs) between gastric carcinoma and non-cancerous tissues in GSE54129, GSE26899, and The Cancer Genome Atlas datasets. Red dots represent significantly up-regulated genes; green dots represent significantly down-regulated genes; black dots represent non-differentially expressed genes. P < 0.05 and |log2 FC| > 1.0 were considered significant; B: Venn diagrams showing the upregulated overlapped DEGs (left) and downregulated overlapped DEGs (right) in three datasets; C: Heatmaps of the common genes in GSE54129, GSE26899, and The Cancer Genome Atlas datasets (top 50). The common genes include 59 upregulated genes and 36 downregulated genes. Each row represents the expression level of a gene, and each column represents a sample: Red for gastric carcinoma and blue for non-cancerous samples.
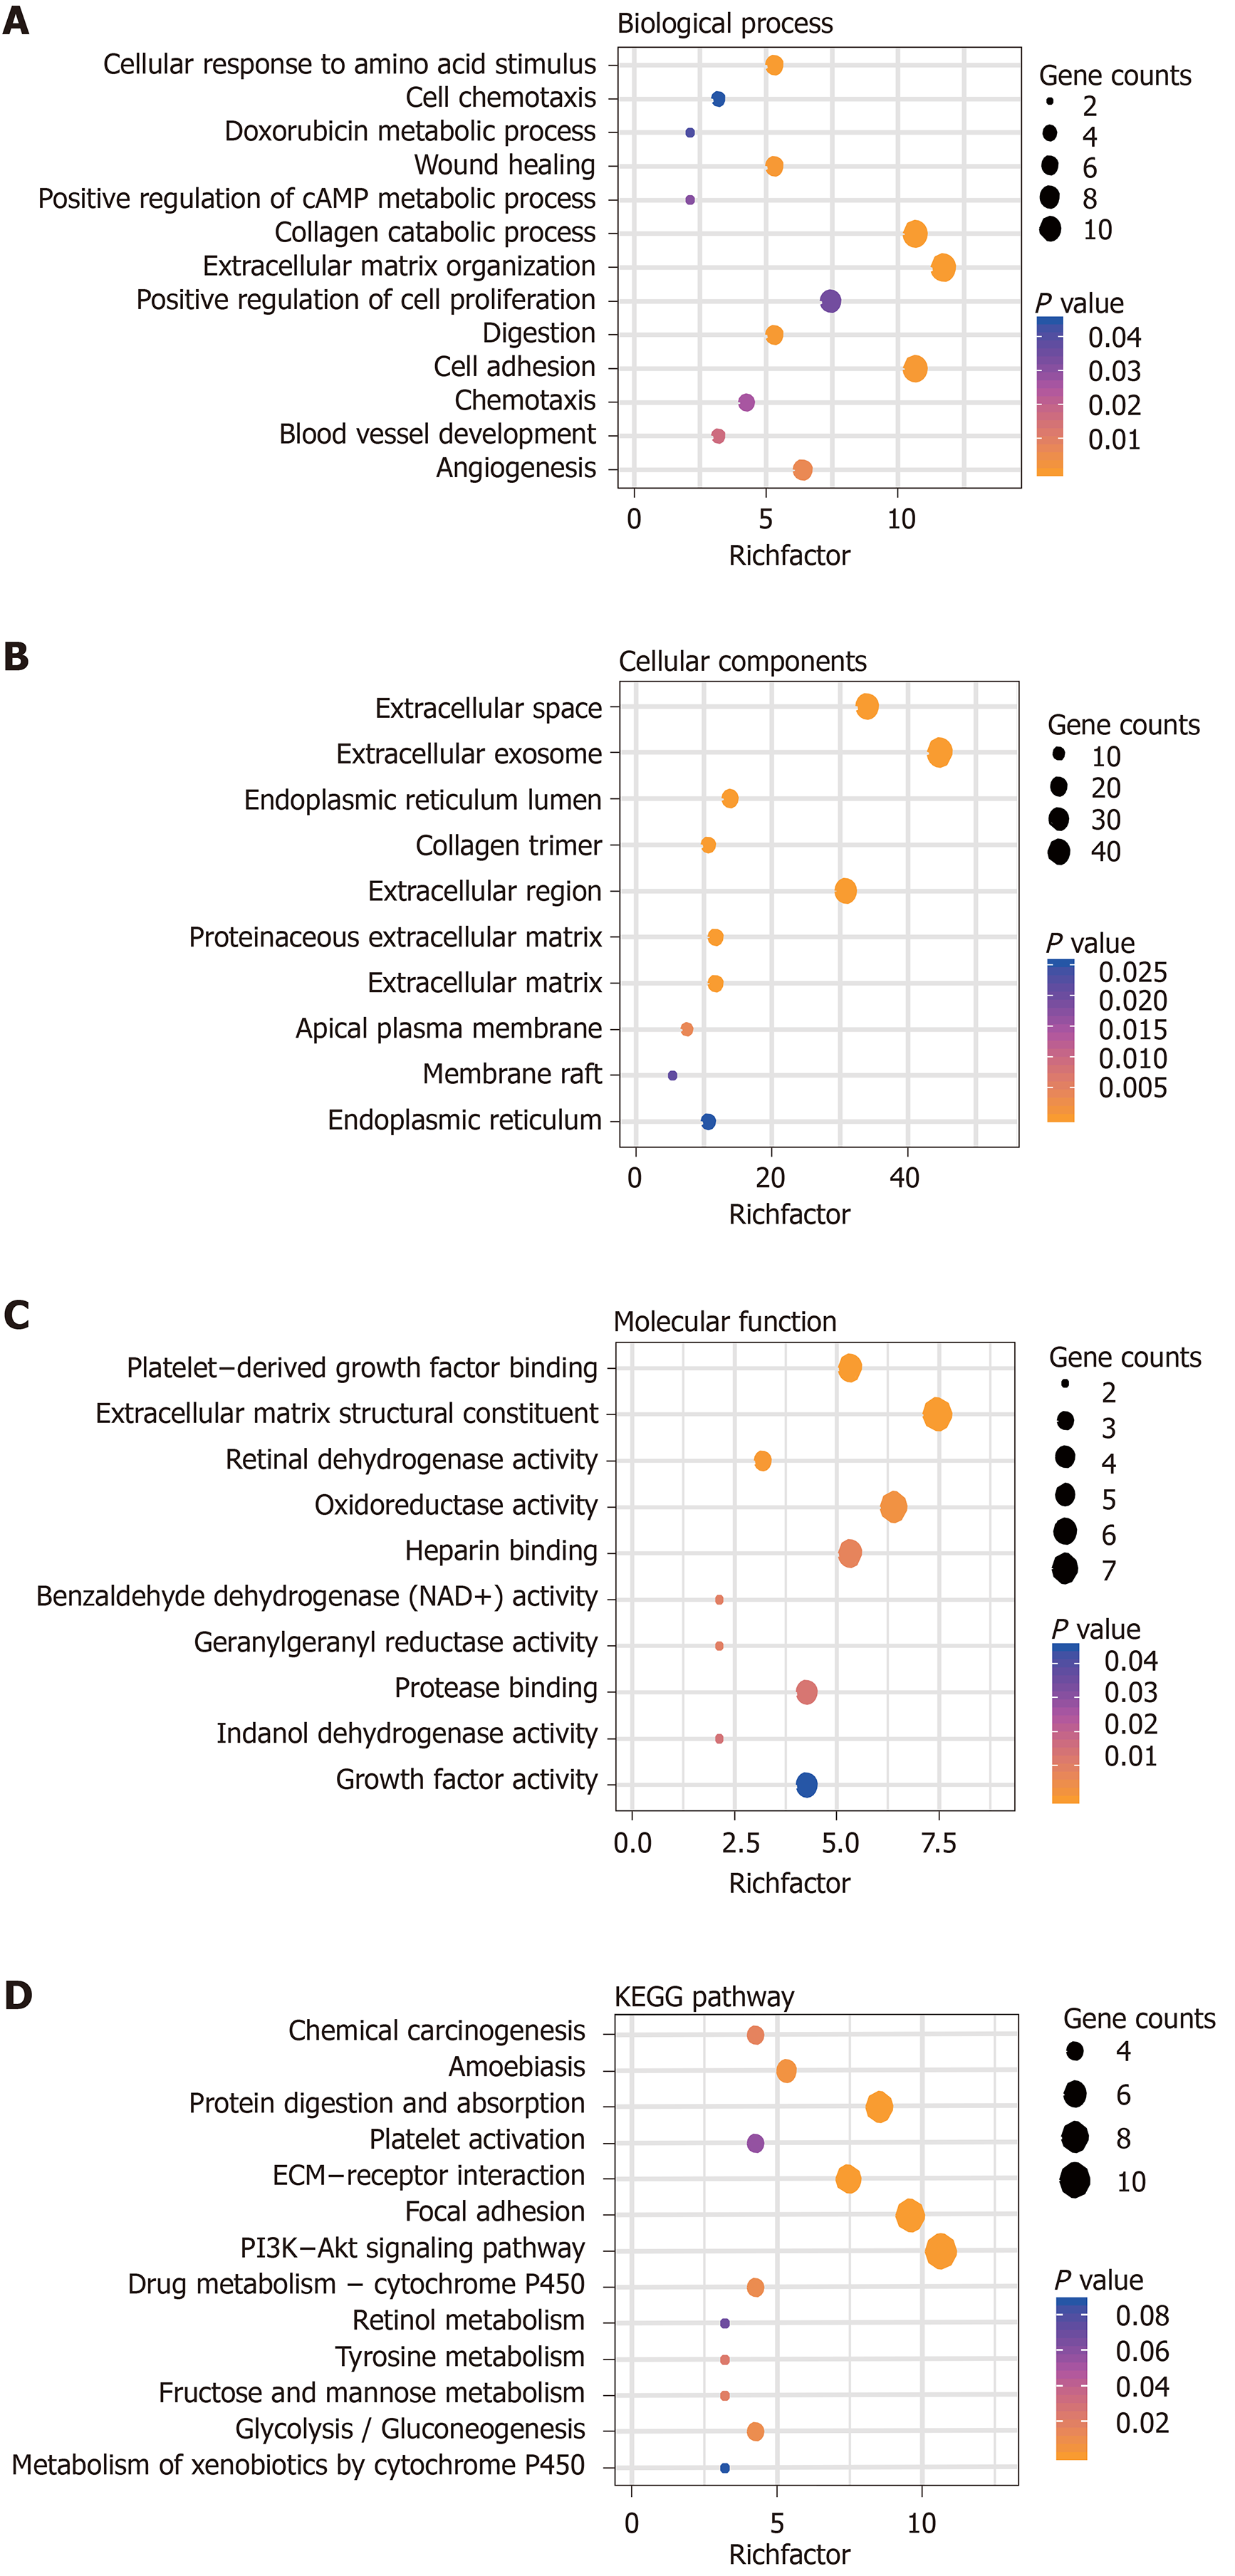
Figure 3 Functional analysis of differentially expressed genes.
Significantly enriched gene ontology biological processes of differentially expressed genes in gastric carcinoma are shown. A: Biological Process; B: Cellular Components; C: Molecular Function; and D: Significantly Enriched Kyoto Encyclopedia of Genes and Genomes Pathways of DEGs in Gastric carcinoma. KEGG: Kyoto Encyclopedia of Genes and Genomes.
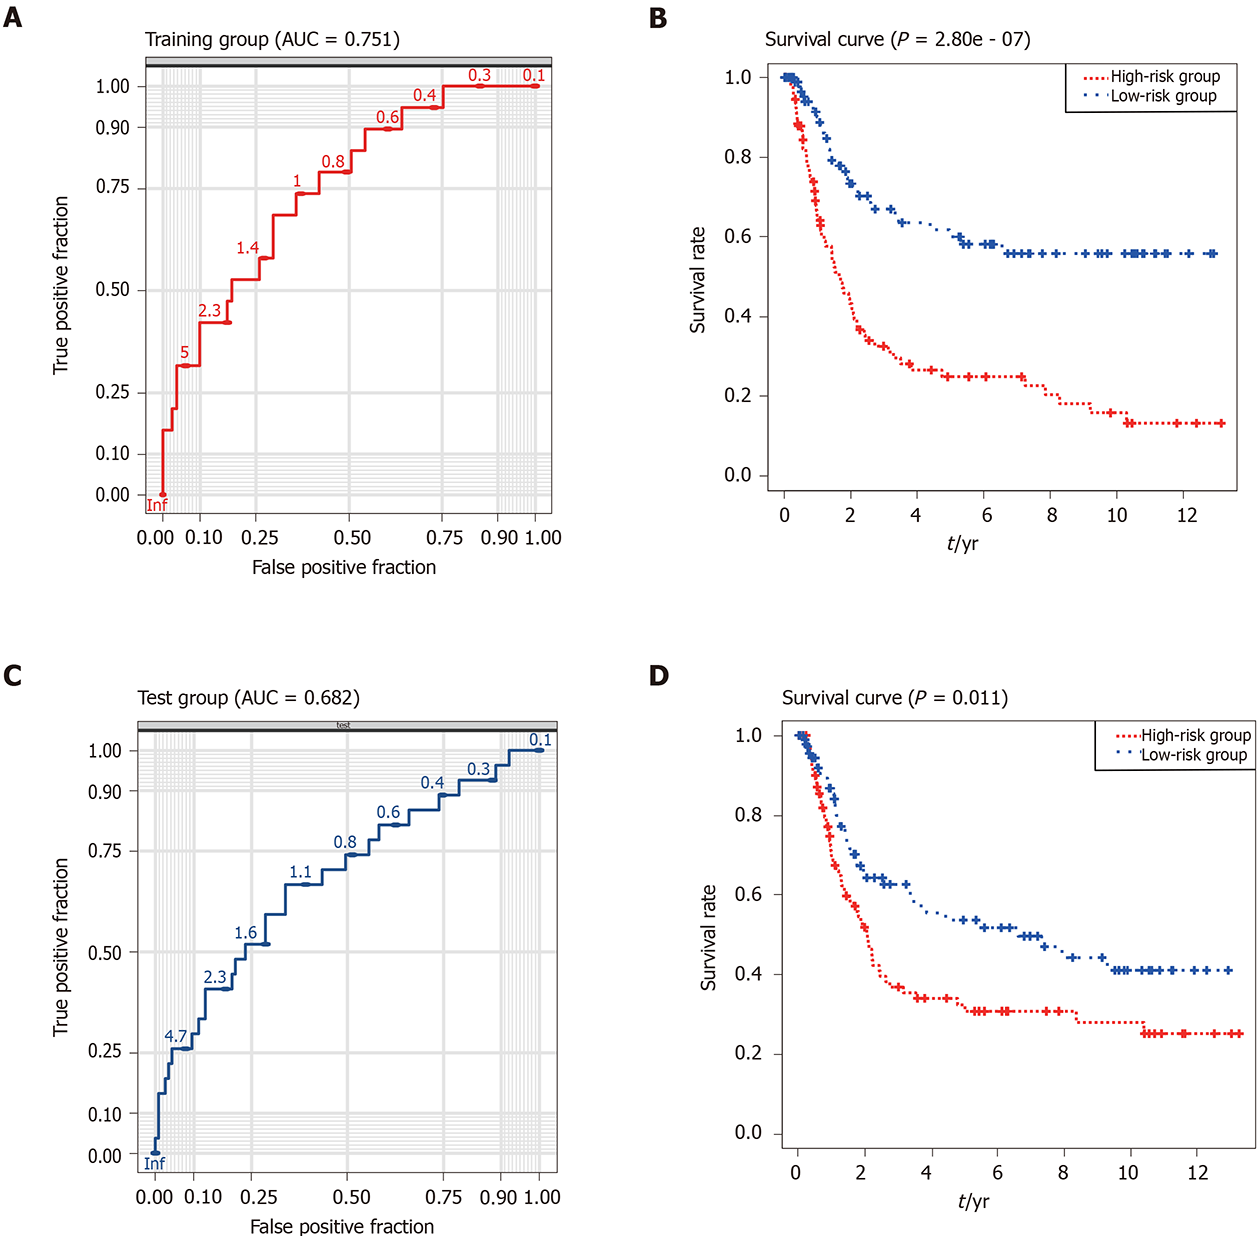
Figure 4 Performance of the risk score model in the training (the Cancer Genome Atlas-stomach adenocarcinoma) and validation (GSE15459) datasets.
A: Receiving operating characteristic curve of the nine-gene signature in the training dataset (area under the curve = 0.751); B: Kaplan–Meier survival curve for gastric carcinoma patients in the training dataset (P < 0.001). C: Receiving operating characteristic curve of the nine-gene signature in the validation datasets (area under the curve = 0.682); D: Kaplan–Meier survival curve for gastric carcinoma patients in the validation dataset (P = 0.011). The blue curve represents low risk score group. The red curve represents high risk score group. AUC: Area under the curve.
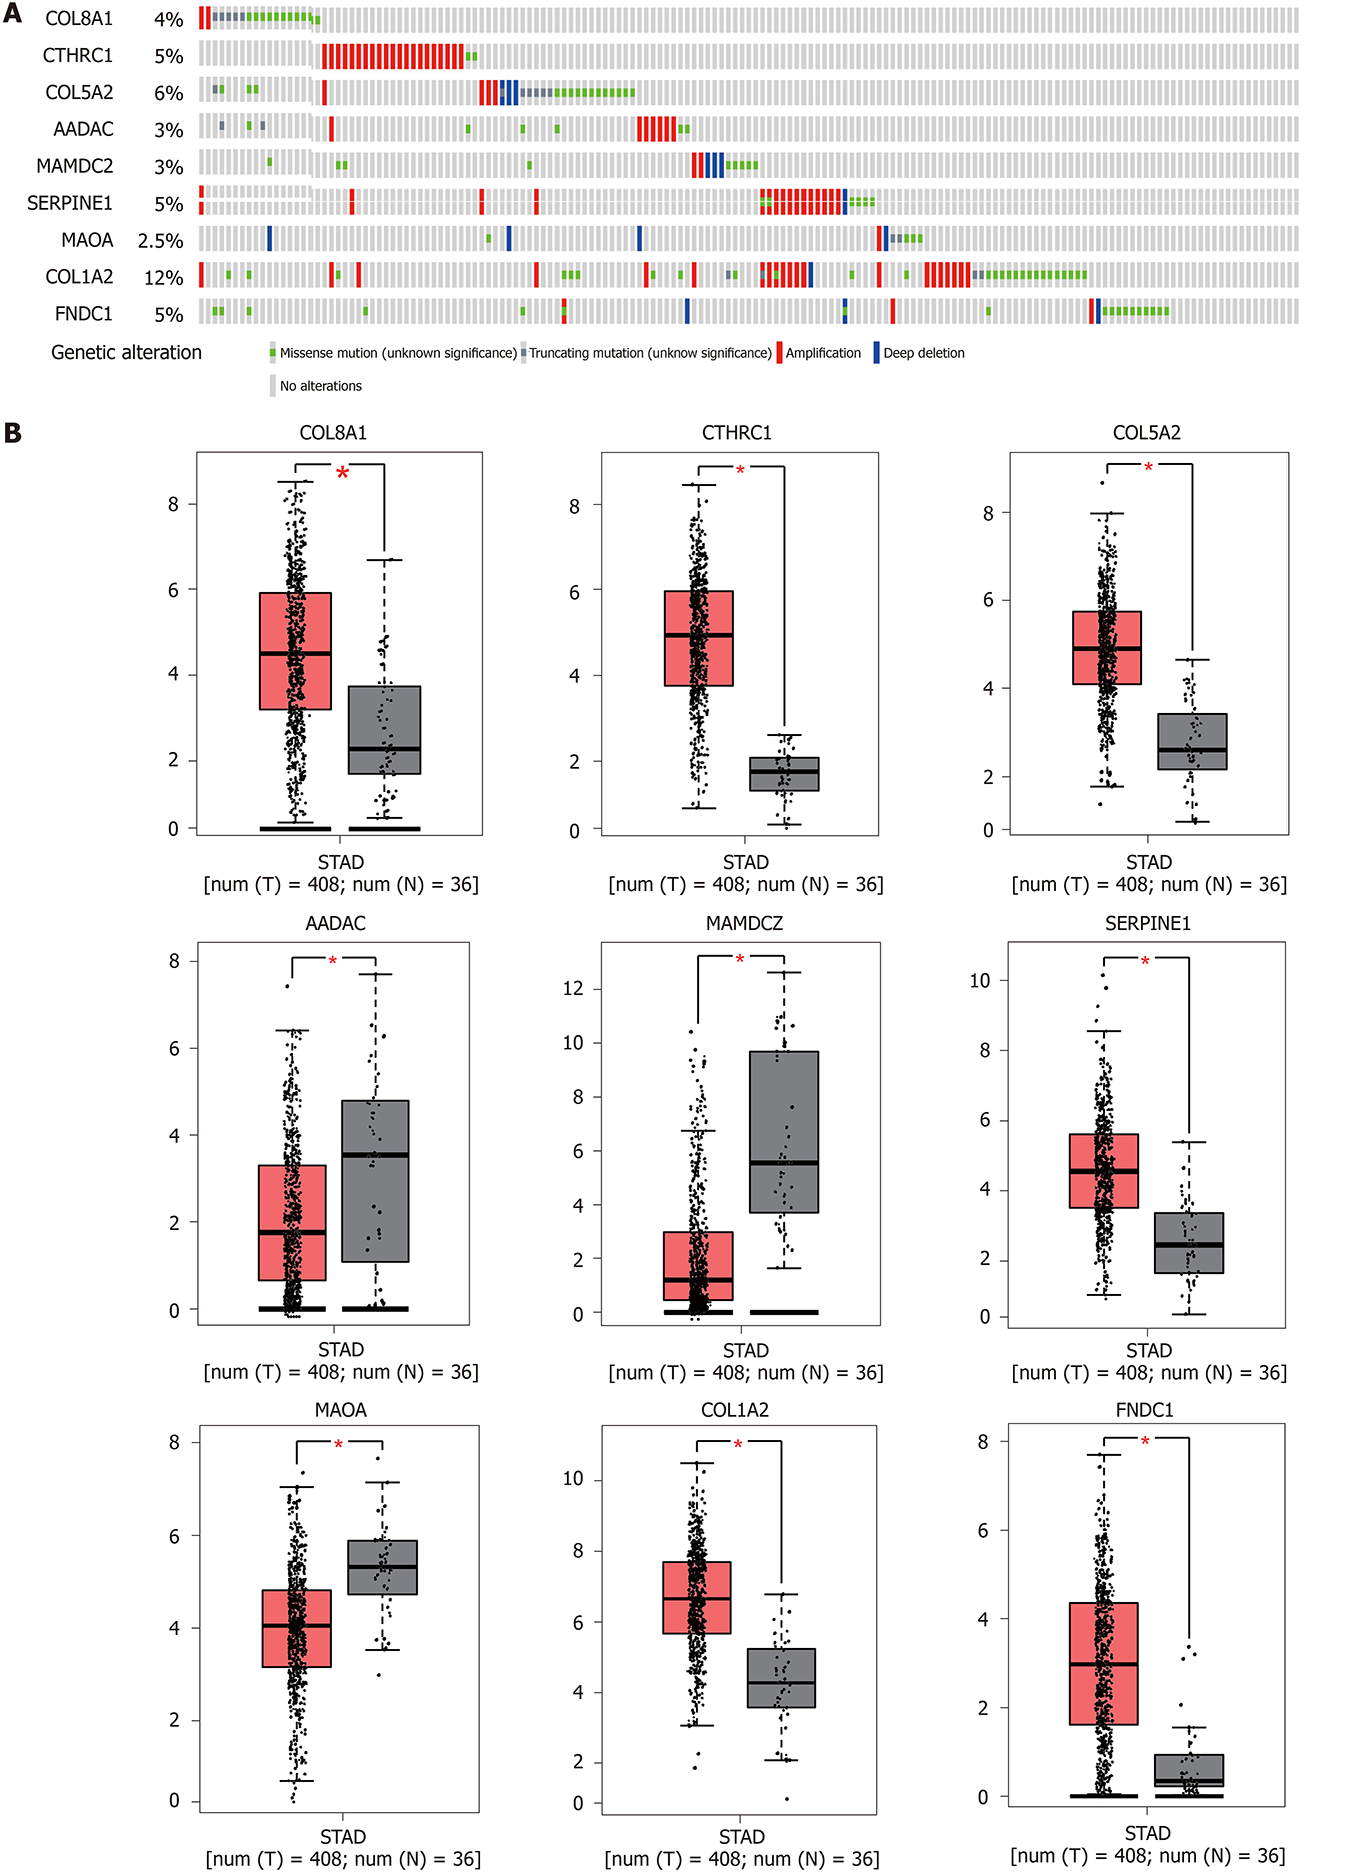
Figure 5 Genetic alterations and expression of the nine prognostic genes in gastric carcinoma.
A: Alteration proportion for the nine genes in 375 gastric carcinoma samples in the cBioPortal database; B: Gene expression levels of the nine genes between gastric carcinoma and normal gastric tissues in Gene Expression Profiling Interactive Analysis database. Red represents P < 0.05.
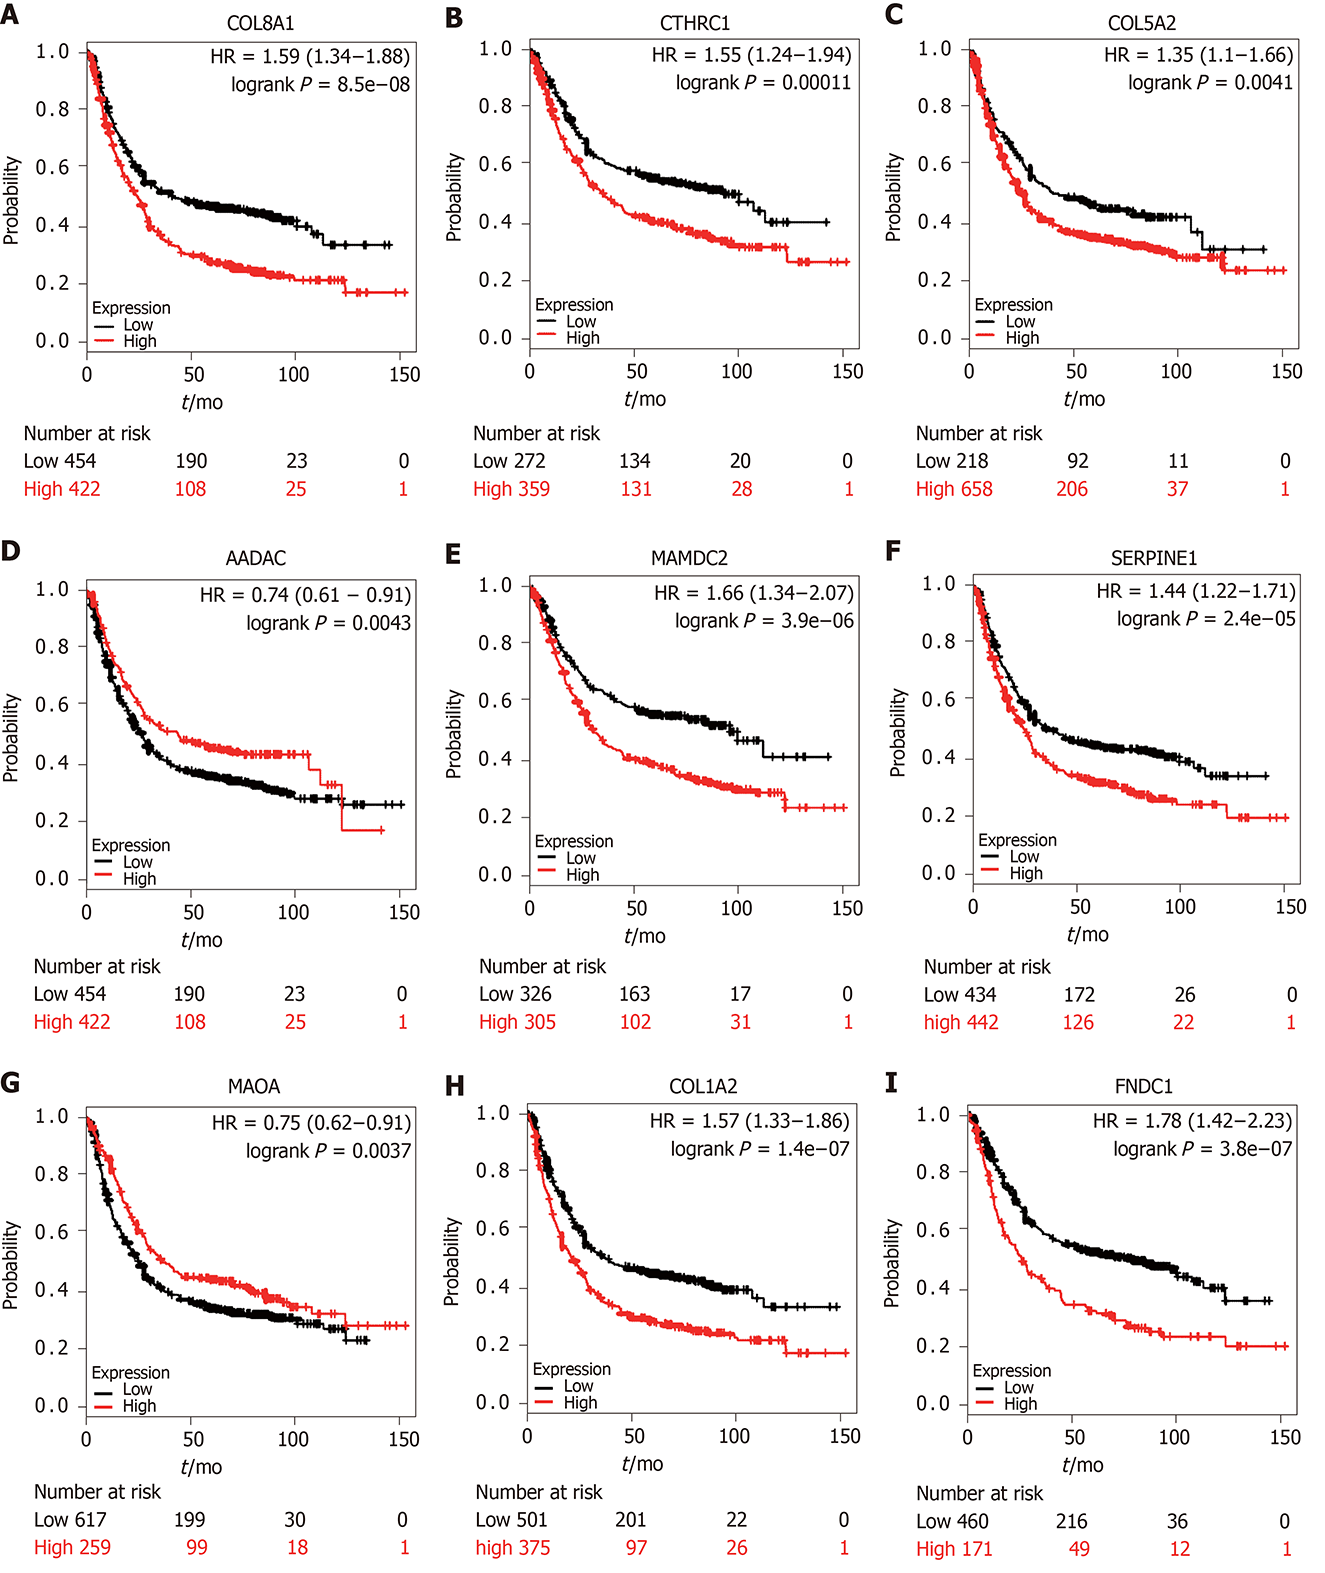
Figure 6 Prognostic value of the nine prognostic genes in gastric carcinoma.
A: COL8A1 (aP < 0.001); B: CTHRC1 (bP < 0.001), C: COL5A2 (cP = 0.004); D: AADAC (dP = 0.004); E: MAMDC2 (eP < 0.001); F: SERPINE1 (fP < 0.001); G: MAOA (gP = 0.003); H: COL1A2 (hP < 0.001); I: MAOA (iP < 0.001).
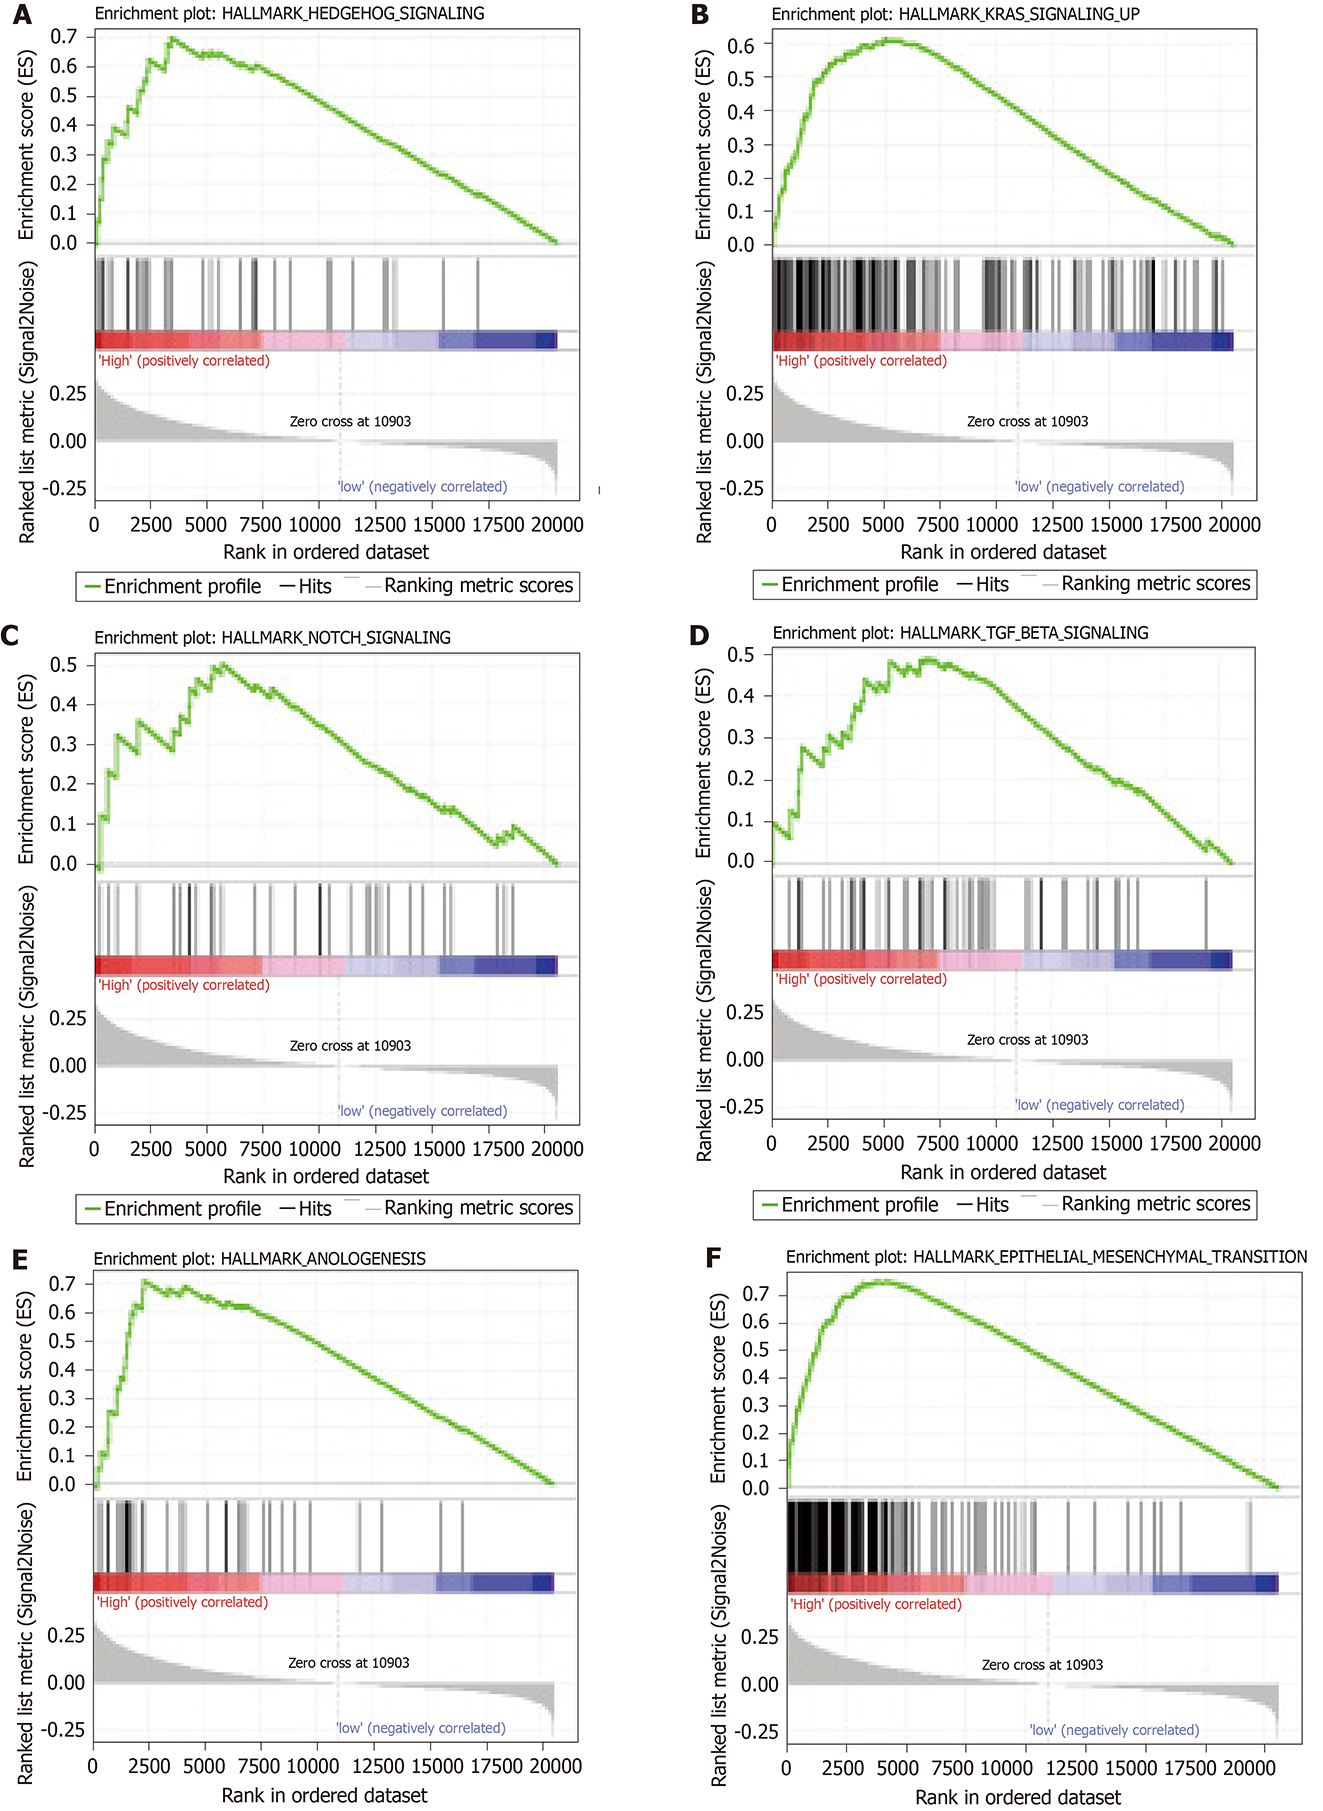
Figure 7 Promising signaling pathways identified by Gene Set Enrichment Analysis.
Only six of the most significant tumor-associated pathways enriched in high-risk group gastric carcinoma patients are listed. A: Hedgehog signaling; B: Kirsten rat sarcoma viral oncogene homologue signaling; C: Notch signaling; D: TGF-β signaling; E: Angiogenesis; F: Epithelial-mesenchymal transition.
- Citation: Wu KZ, Xu XH, Zhan CP, Li J, Jiang JL. Identification of a nine-gene prognostic signature for gastric carcinoma using integrated bioinformatics analyses. World J Gastrointest Oncol 2020; 12(9): 975-991
- URL: https://www.wjgnet.com/1948-5204/full/v12/i9/975.htm
- DOI: https://dx.doi.org/10.4251/wjgo.v12.i9.975


