Copyright
©The Author(s) 2020.
World J Gastrointest Oncol. Jan 15, 2020; 12(1): 54-65
Published online Jan 15, 2020. doi: 10.4251/wjgo.v12.i1.54
Published online Jan 15, 2020. doi: 10.4251/wjgo.v12.i1.54
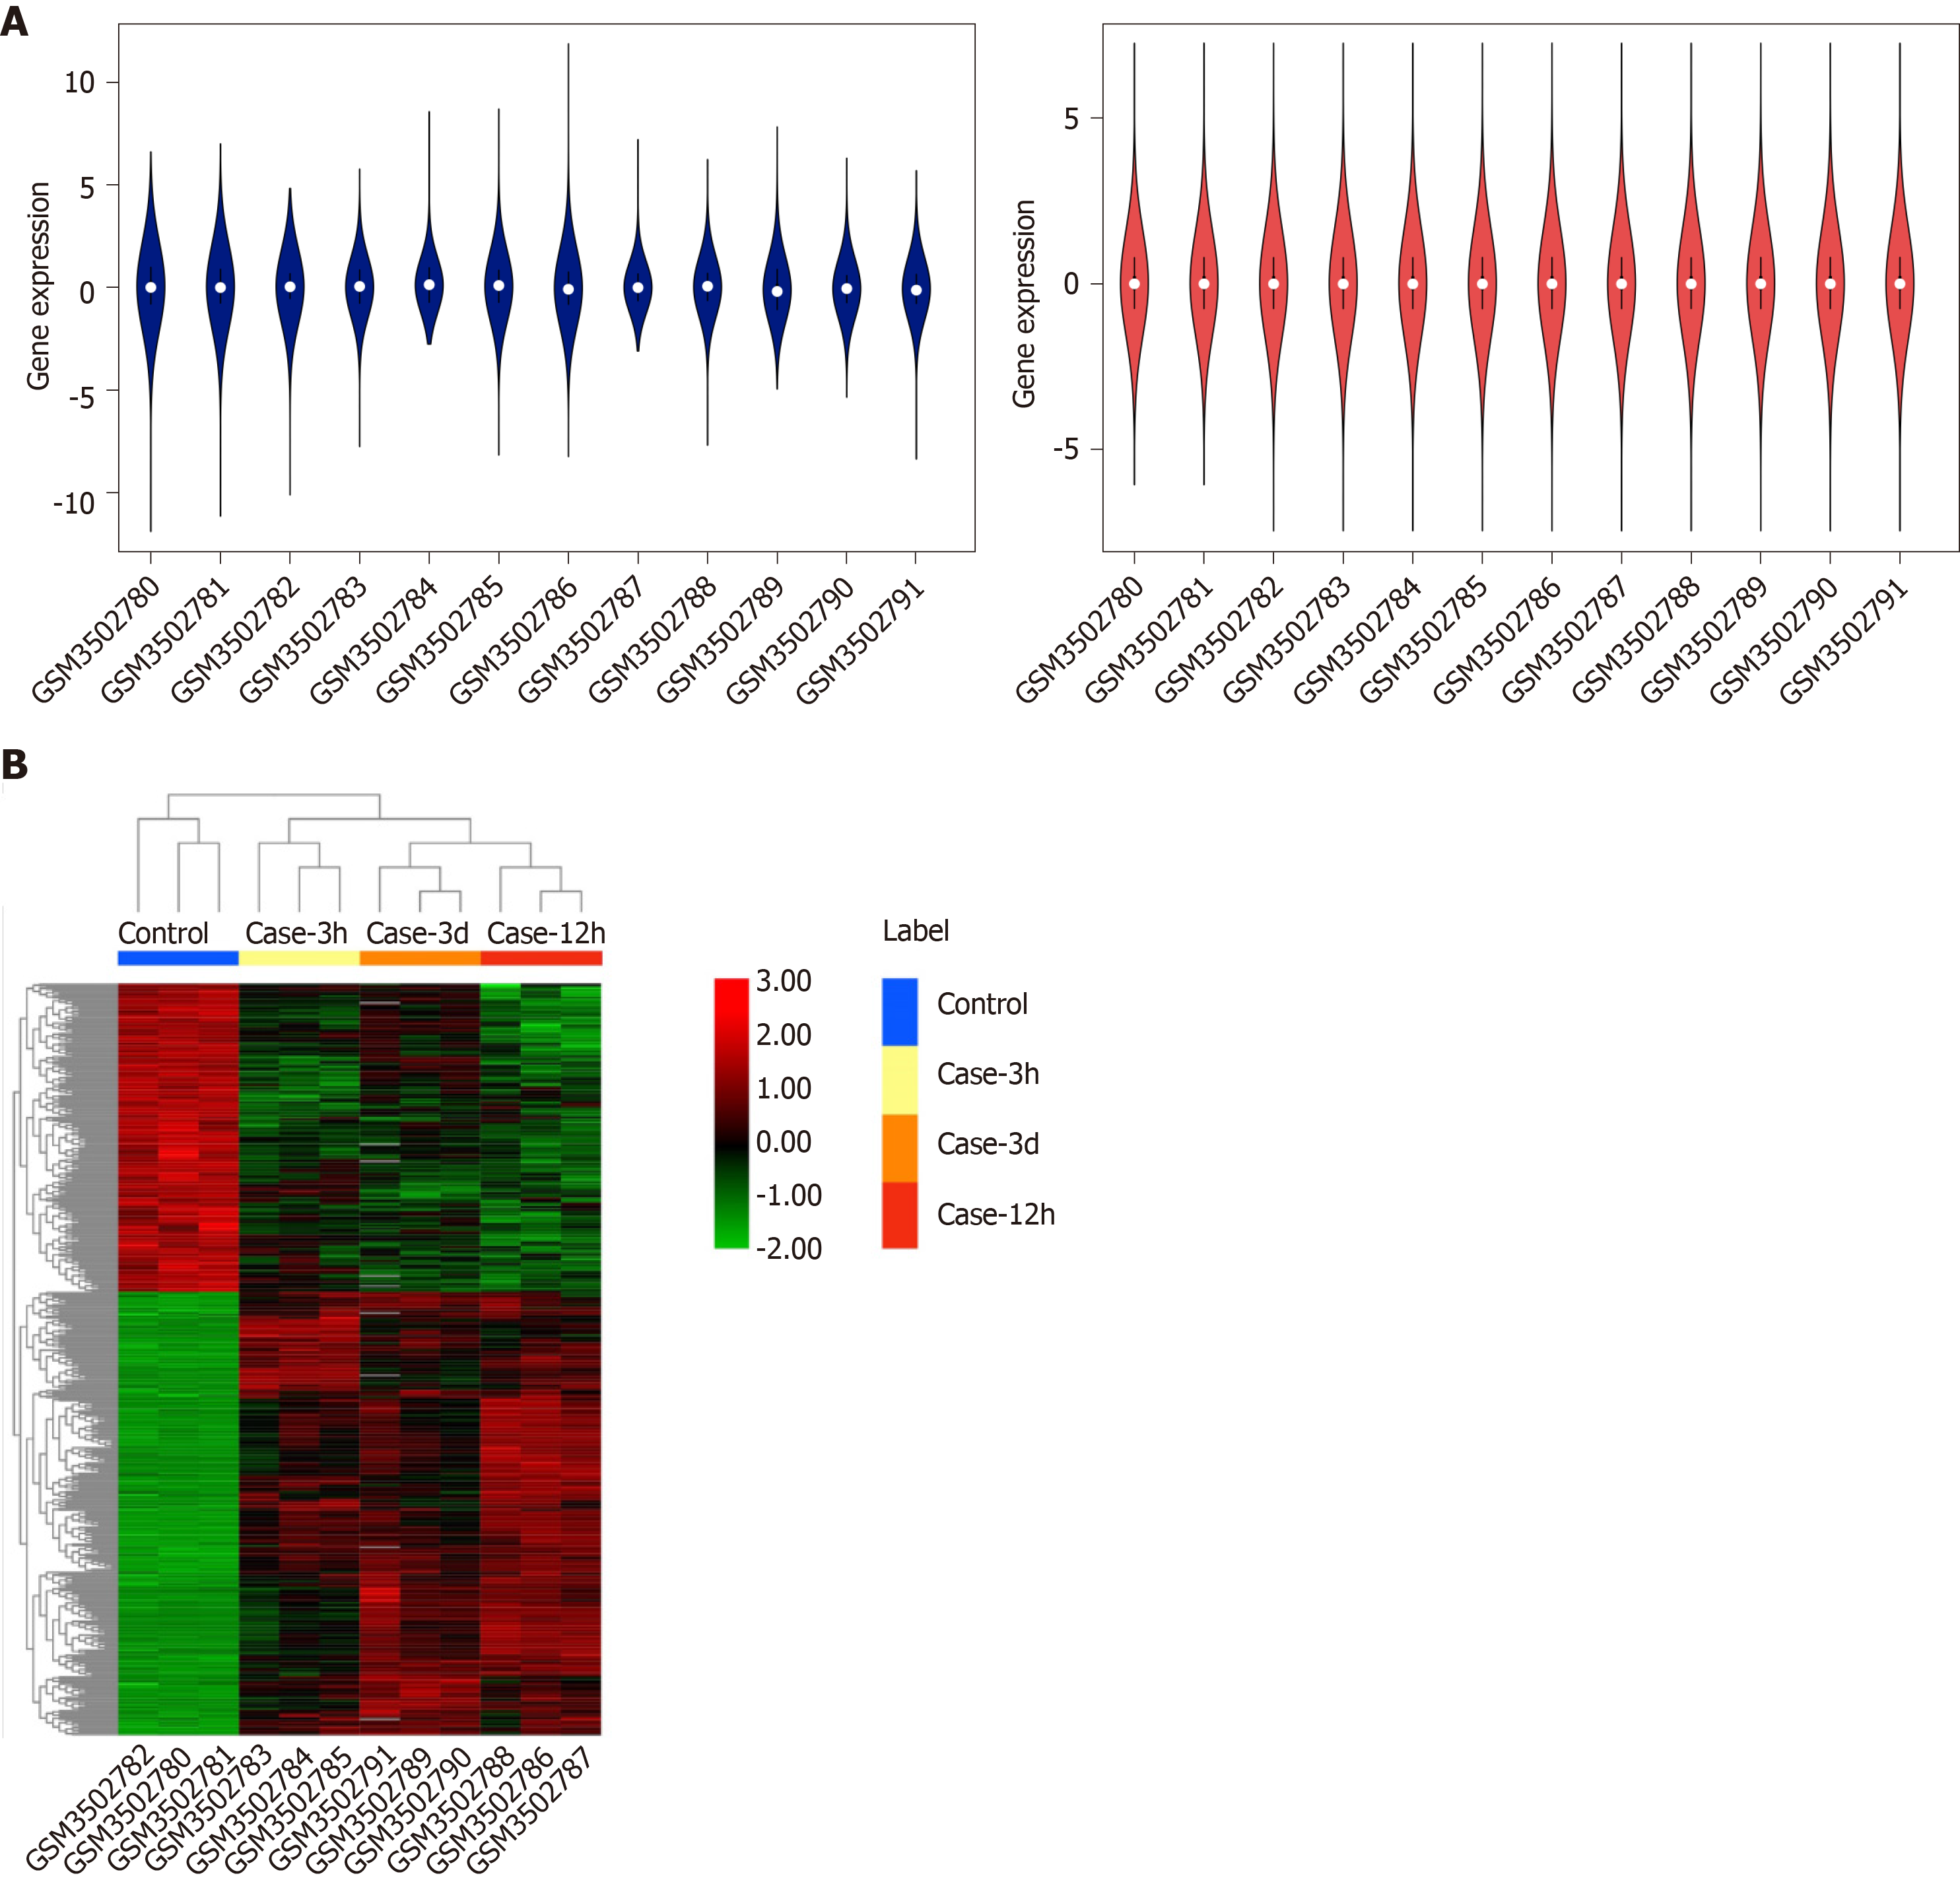
Figure 1 Box plots of data normalization and hierarchical cluster heatmap.
A: Box plots of data normalization. The blue box plot represents the data before normalization, whereas the red box plot represents the normalized data; B: Heatmap of the obtained DEGs.
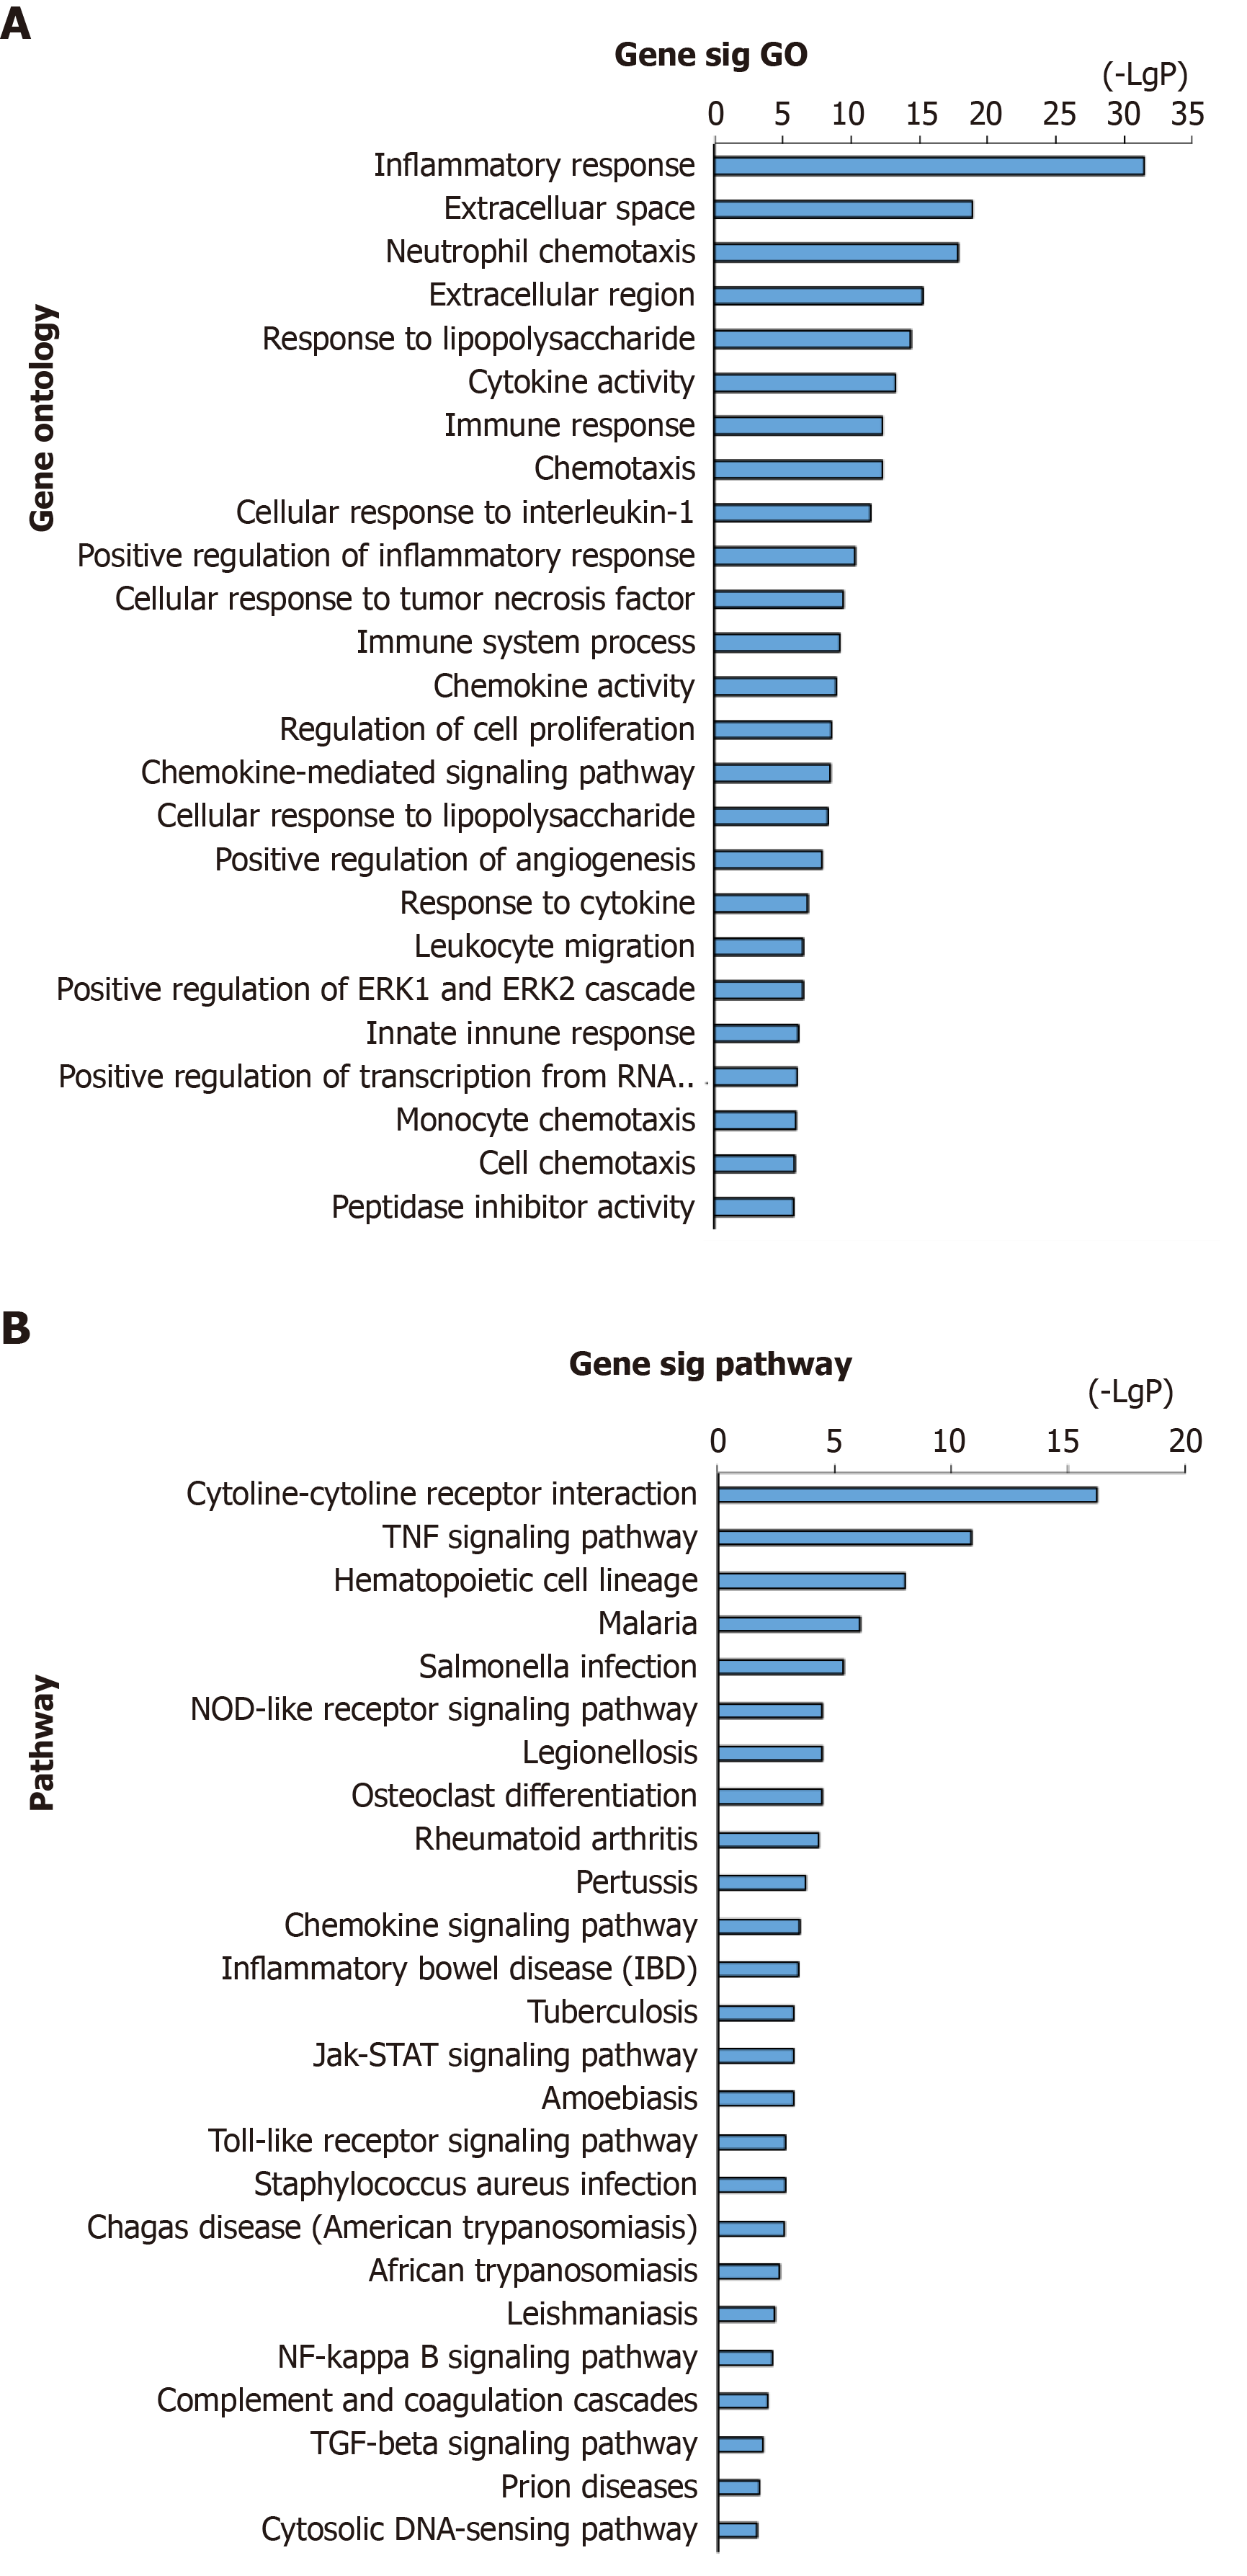
Figure 2 GO annotation and pathway enrichment of DEGs in adhesion formation.
A: GO analysis of DEGs (top 20); B: KEGG enrichment of DEGs (top 20). GO: Gene ontology; DEGs: Differentially expressed genes; KEGG: Kyoto Encyclopedia of Genes and Genomes.
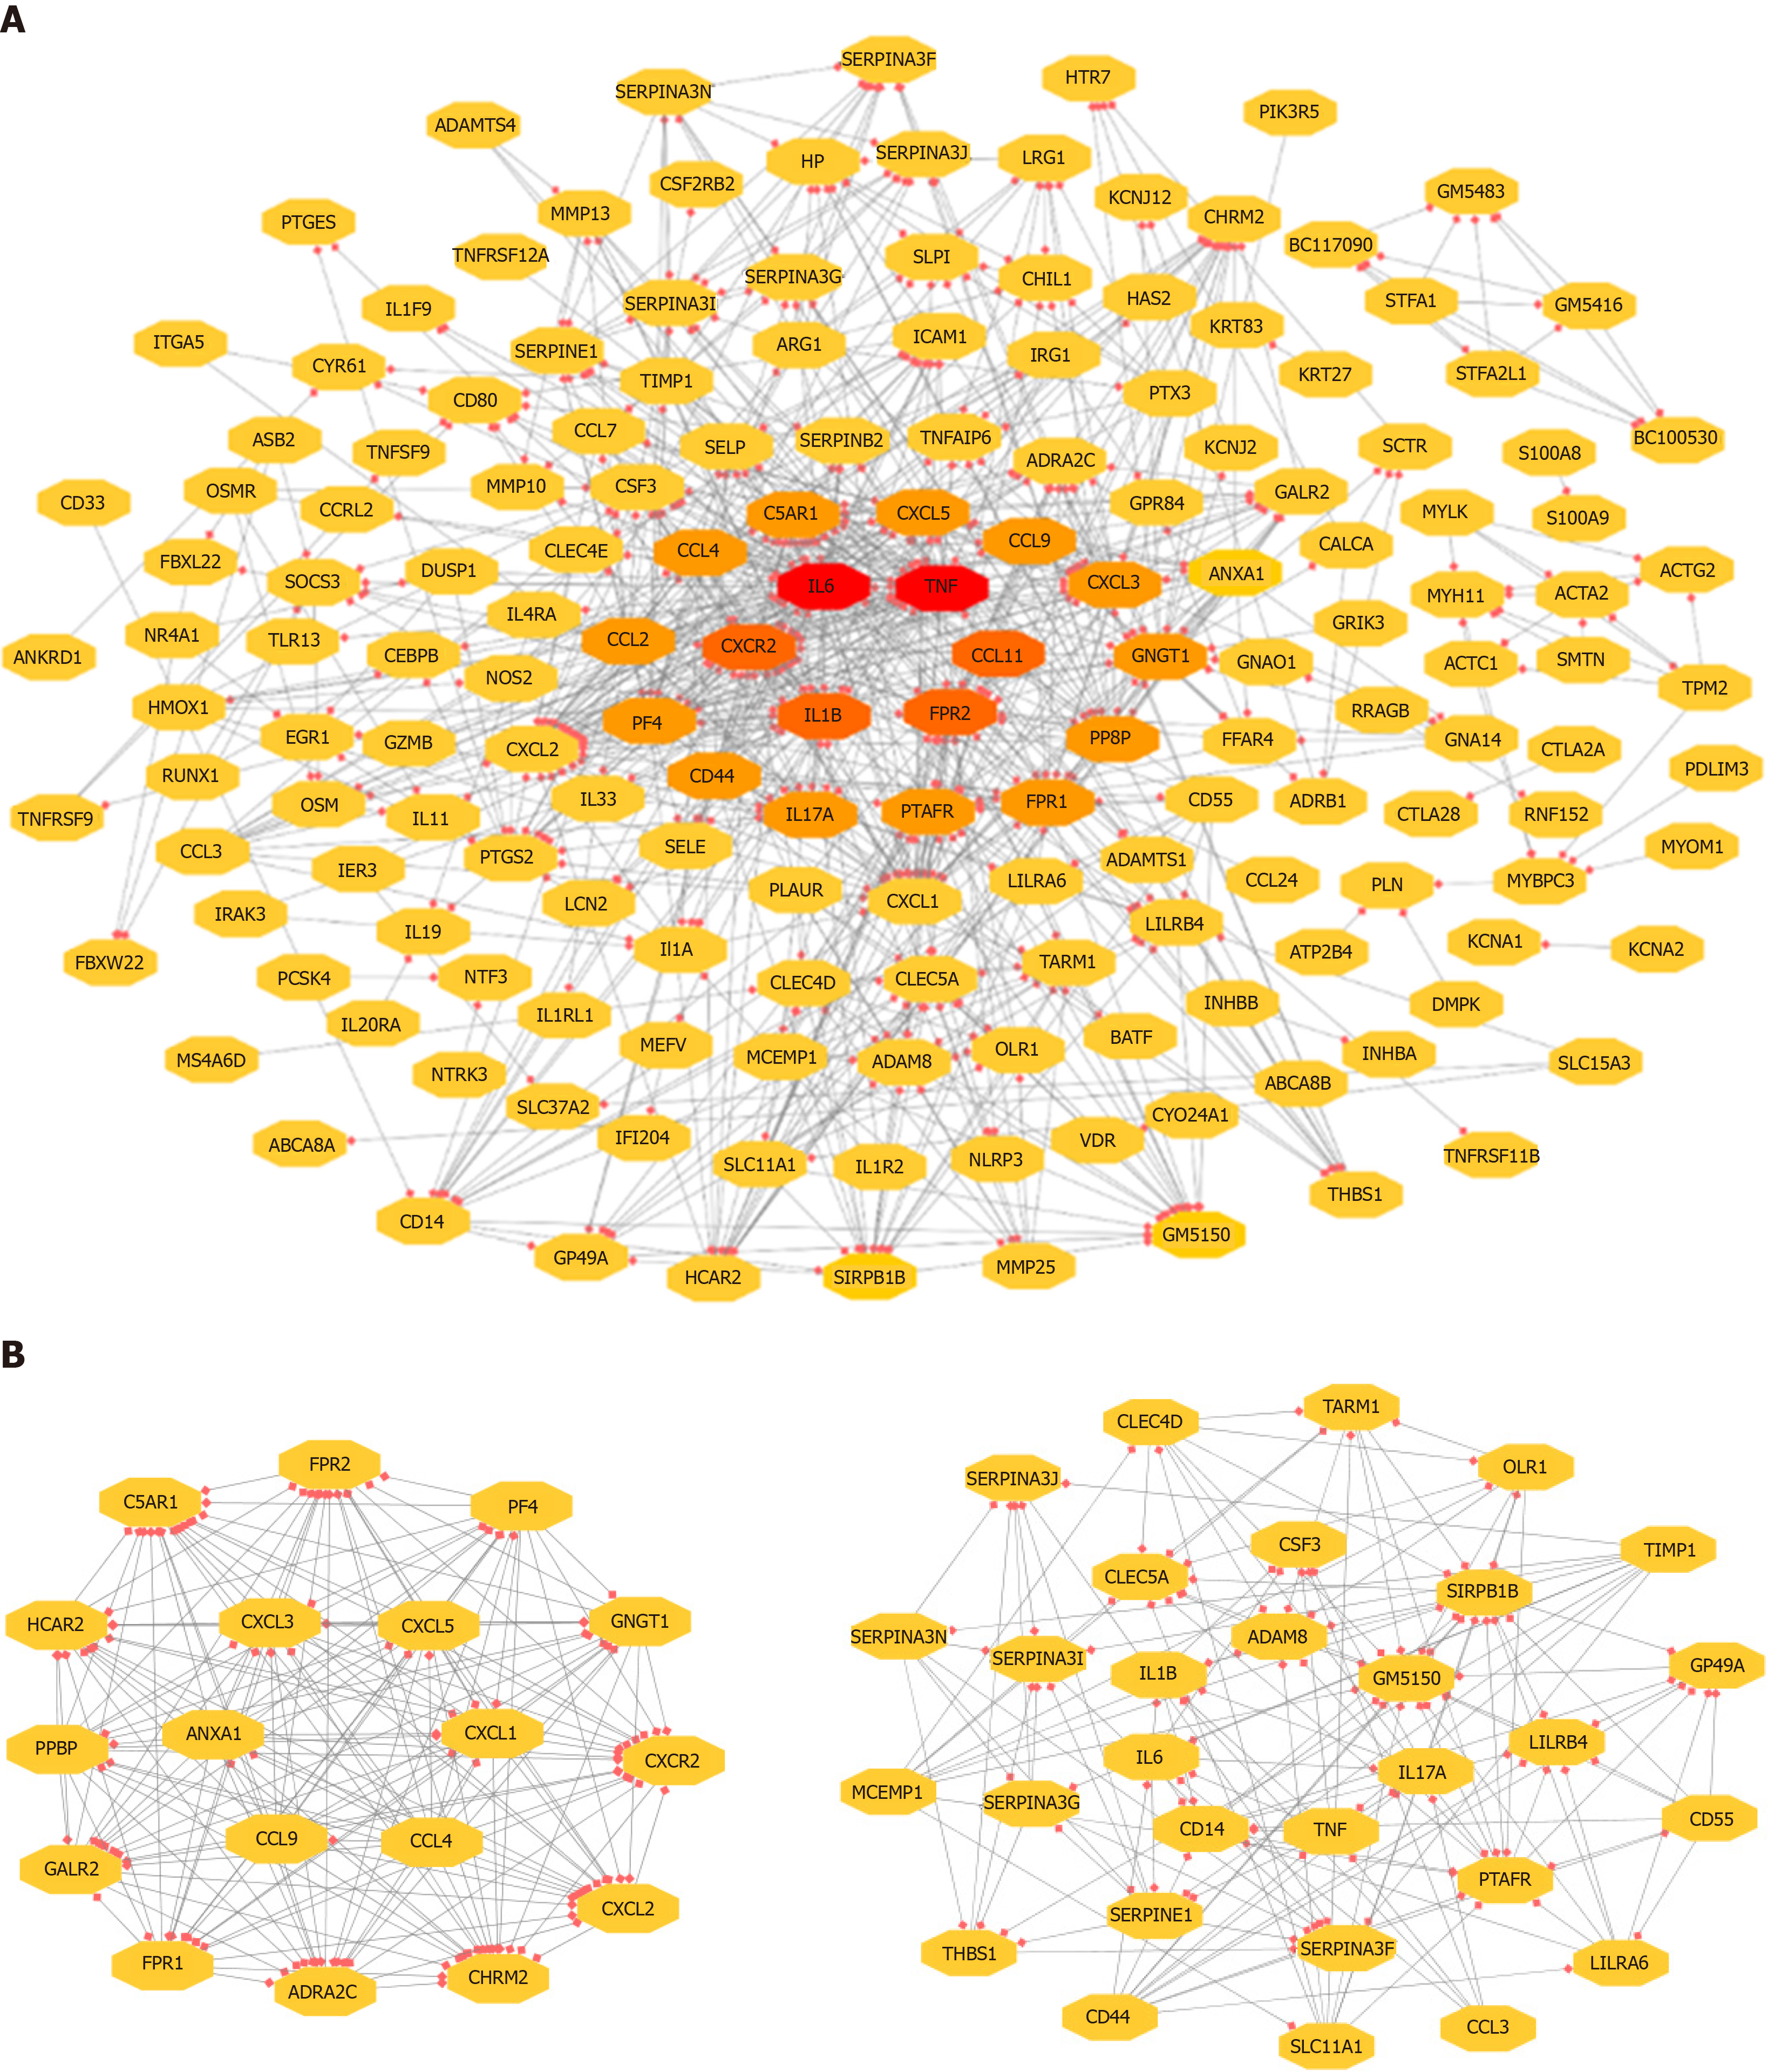
Figure 3 Visualization of the PPI network of identified DEGs.
A: Network of the adhesion formation-associated genes; B: Two significant modules selected from the PPI network. Red: Greater degree; Yellow: Lesser degree. DEG: Differentially expressed genes; PPI: Protein–protein interaction.
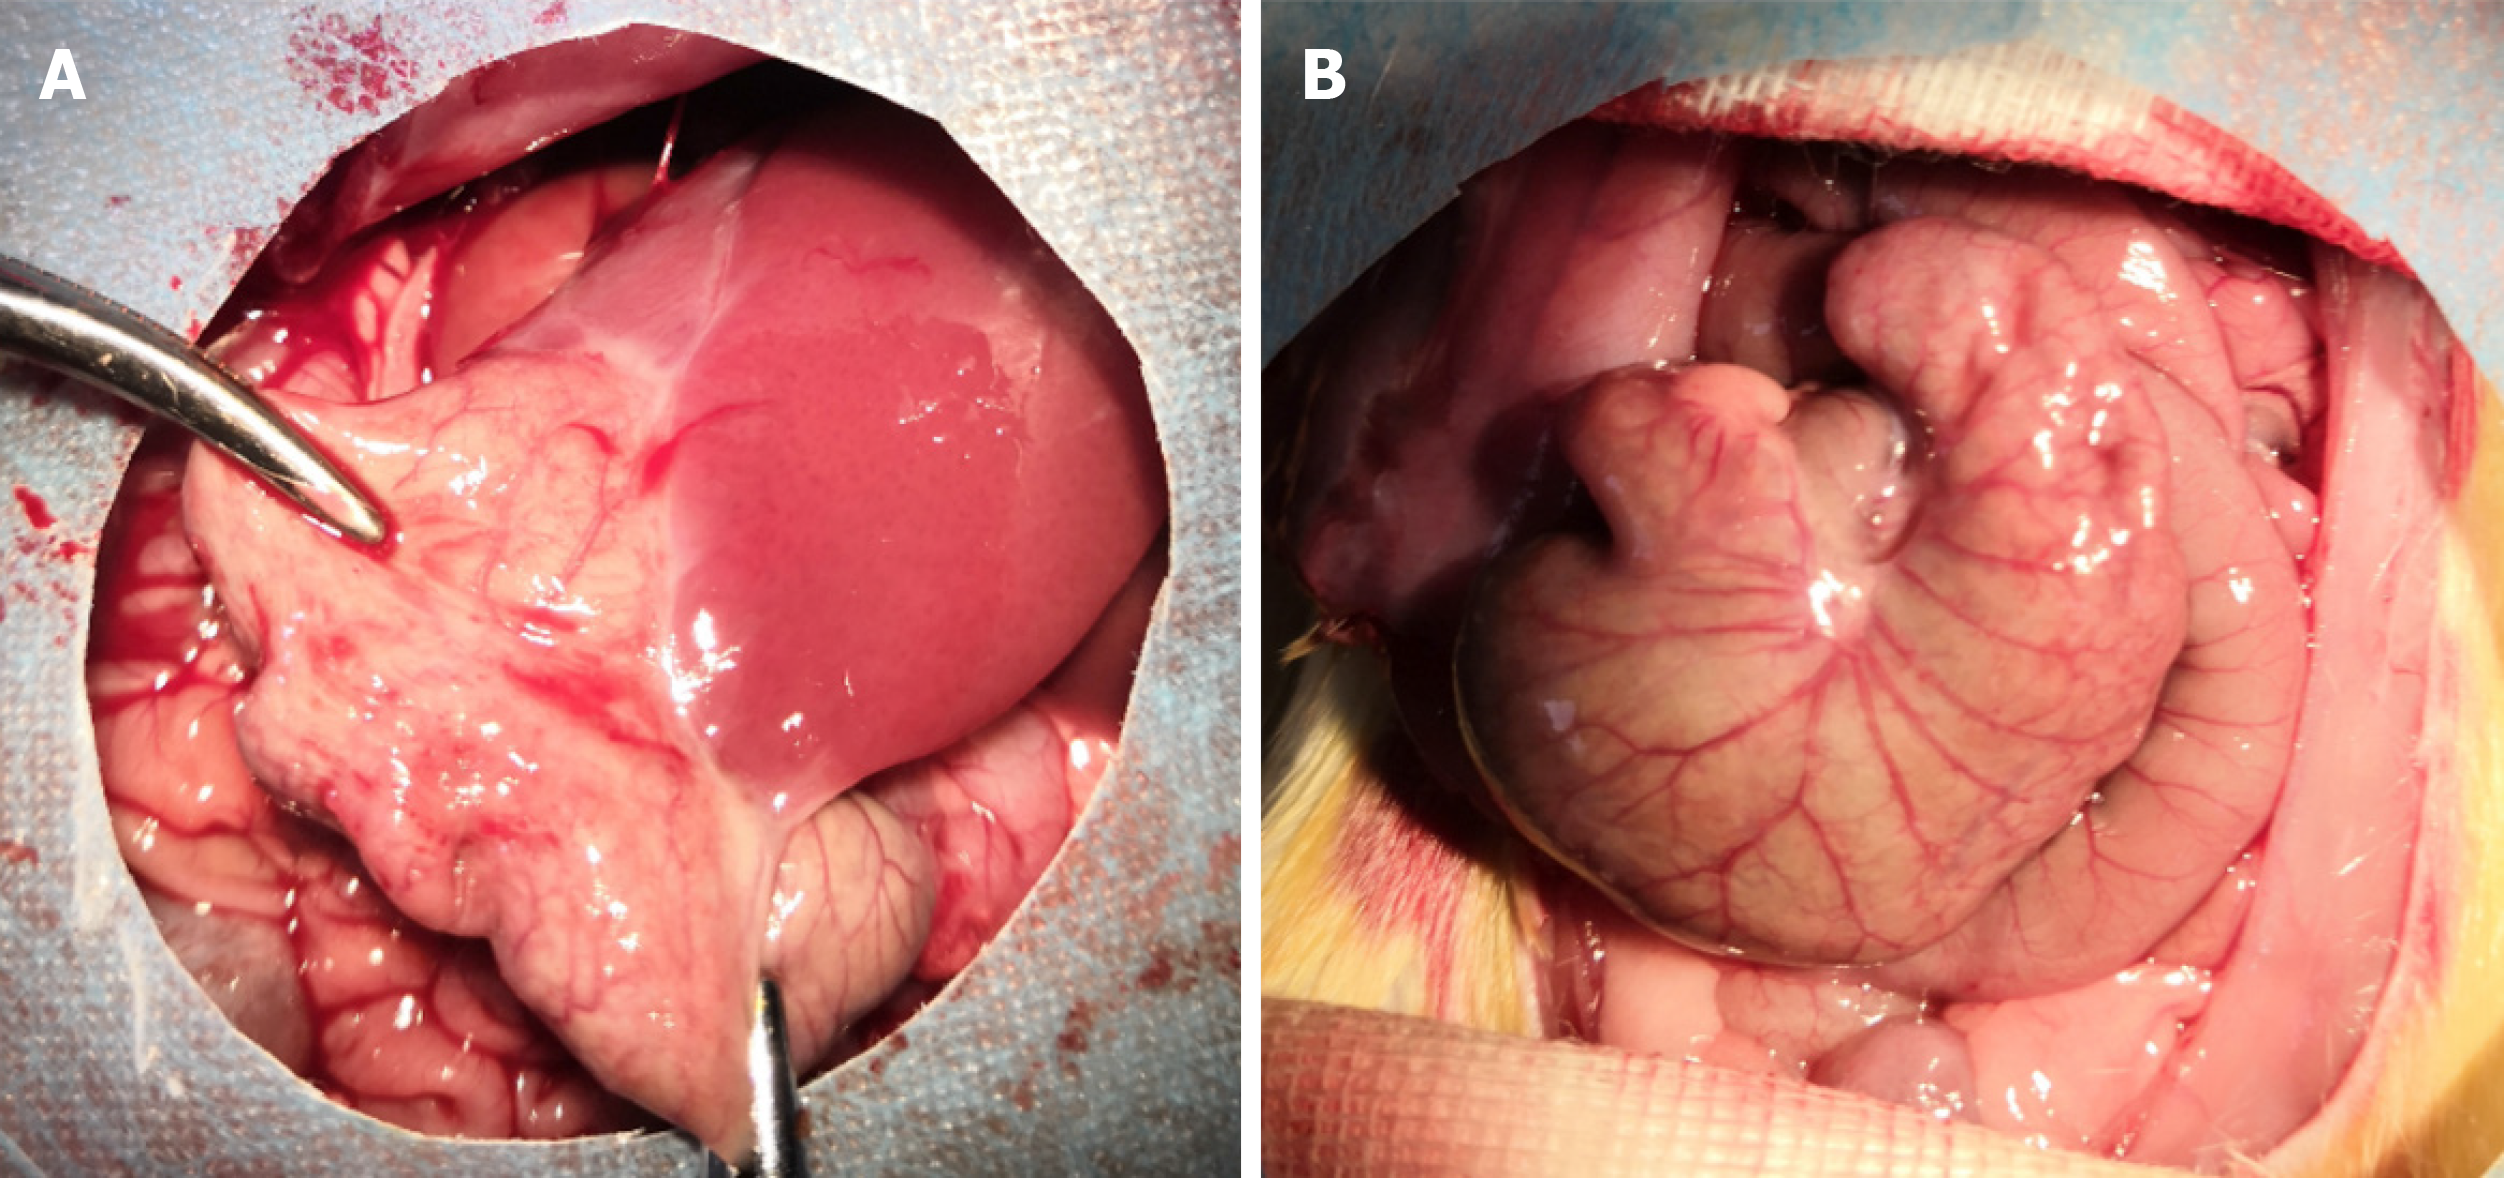
Figure 4 Representative images of PPA in each group.
A: PPA group; B: Sham group.
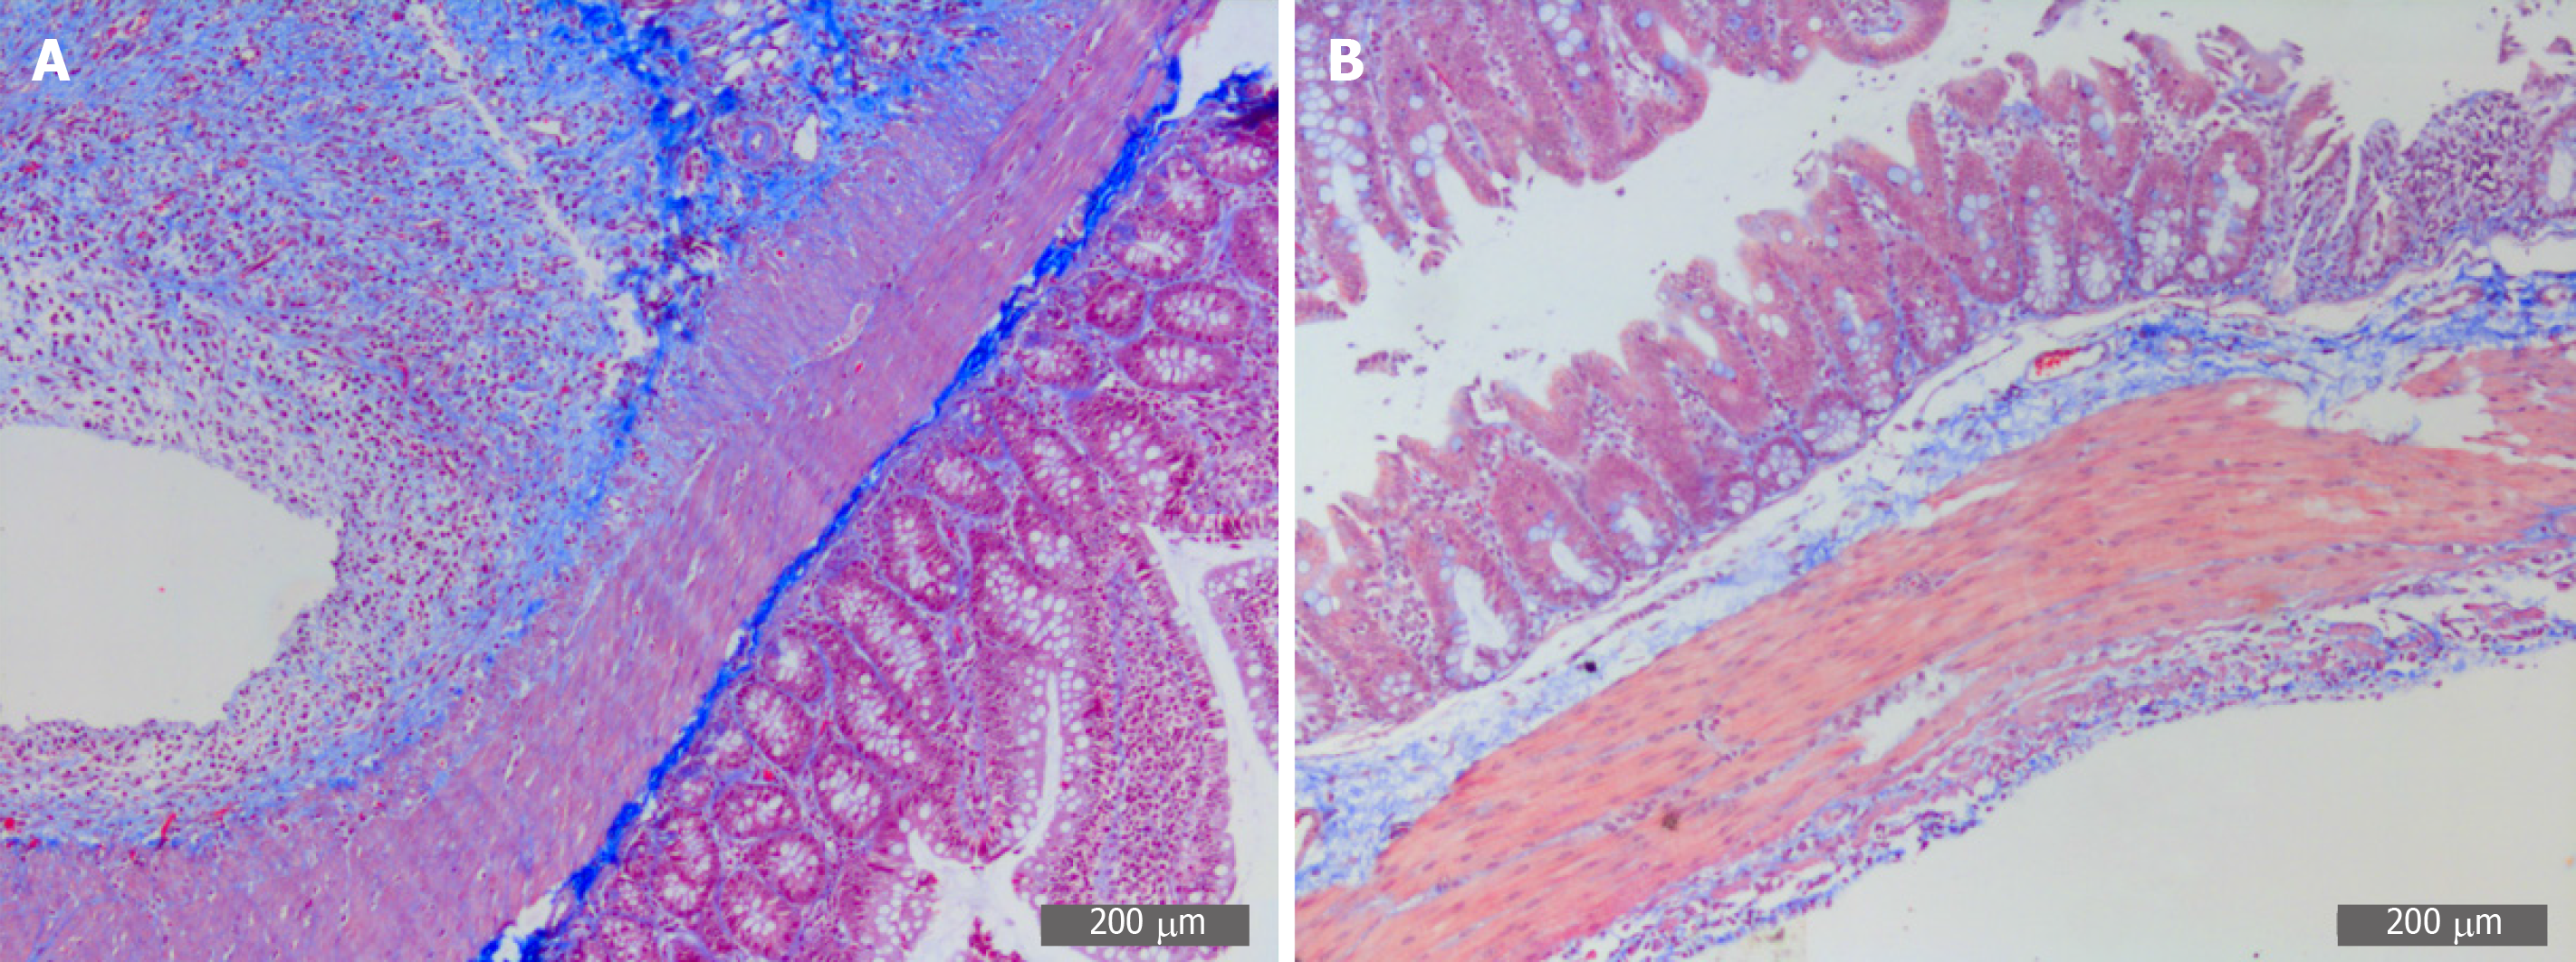
Figure 5 Representative images of Masson staining of adhesive tissues (200×).
A: Masson staining in the PPA group; B: Masson staining in the SH group. PPA: Postoperative peritoneal adhesion; SH: Sham.
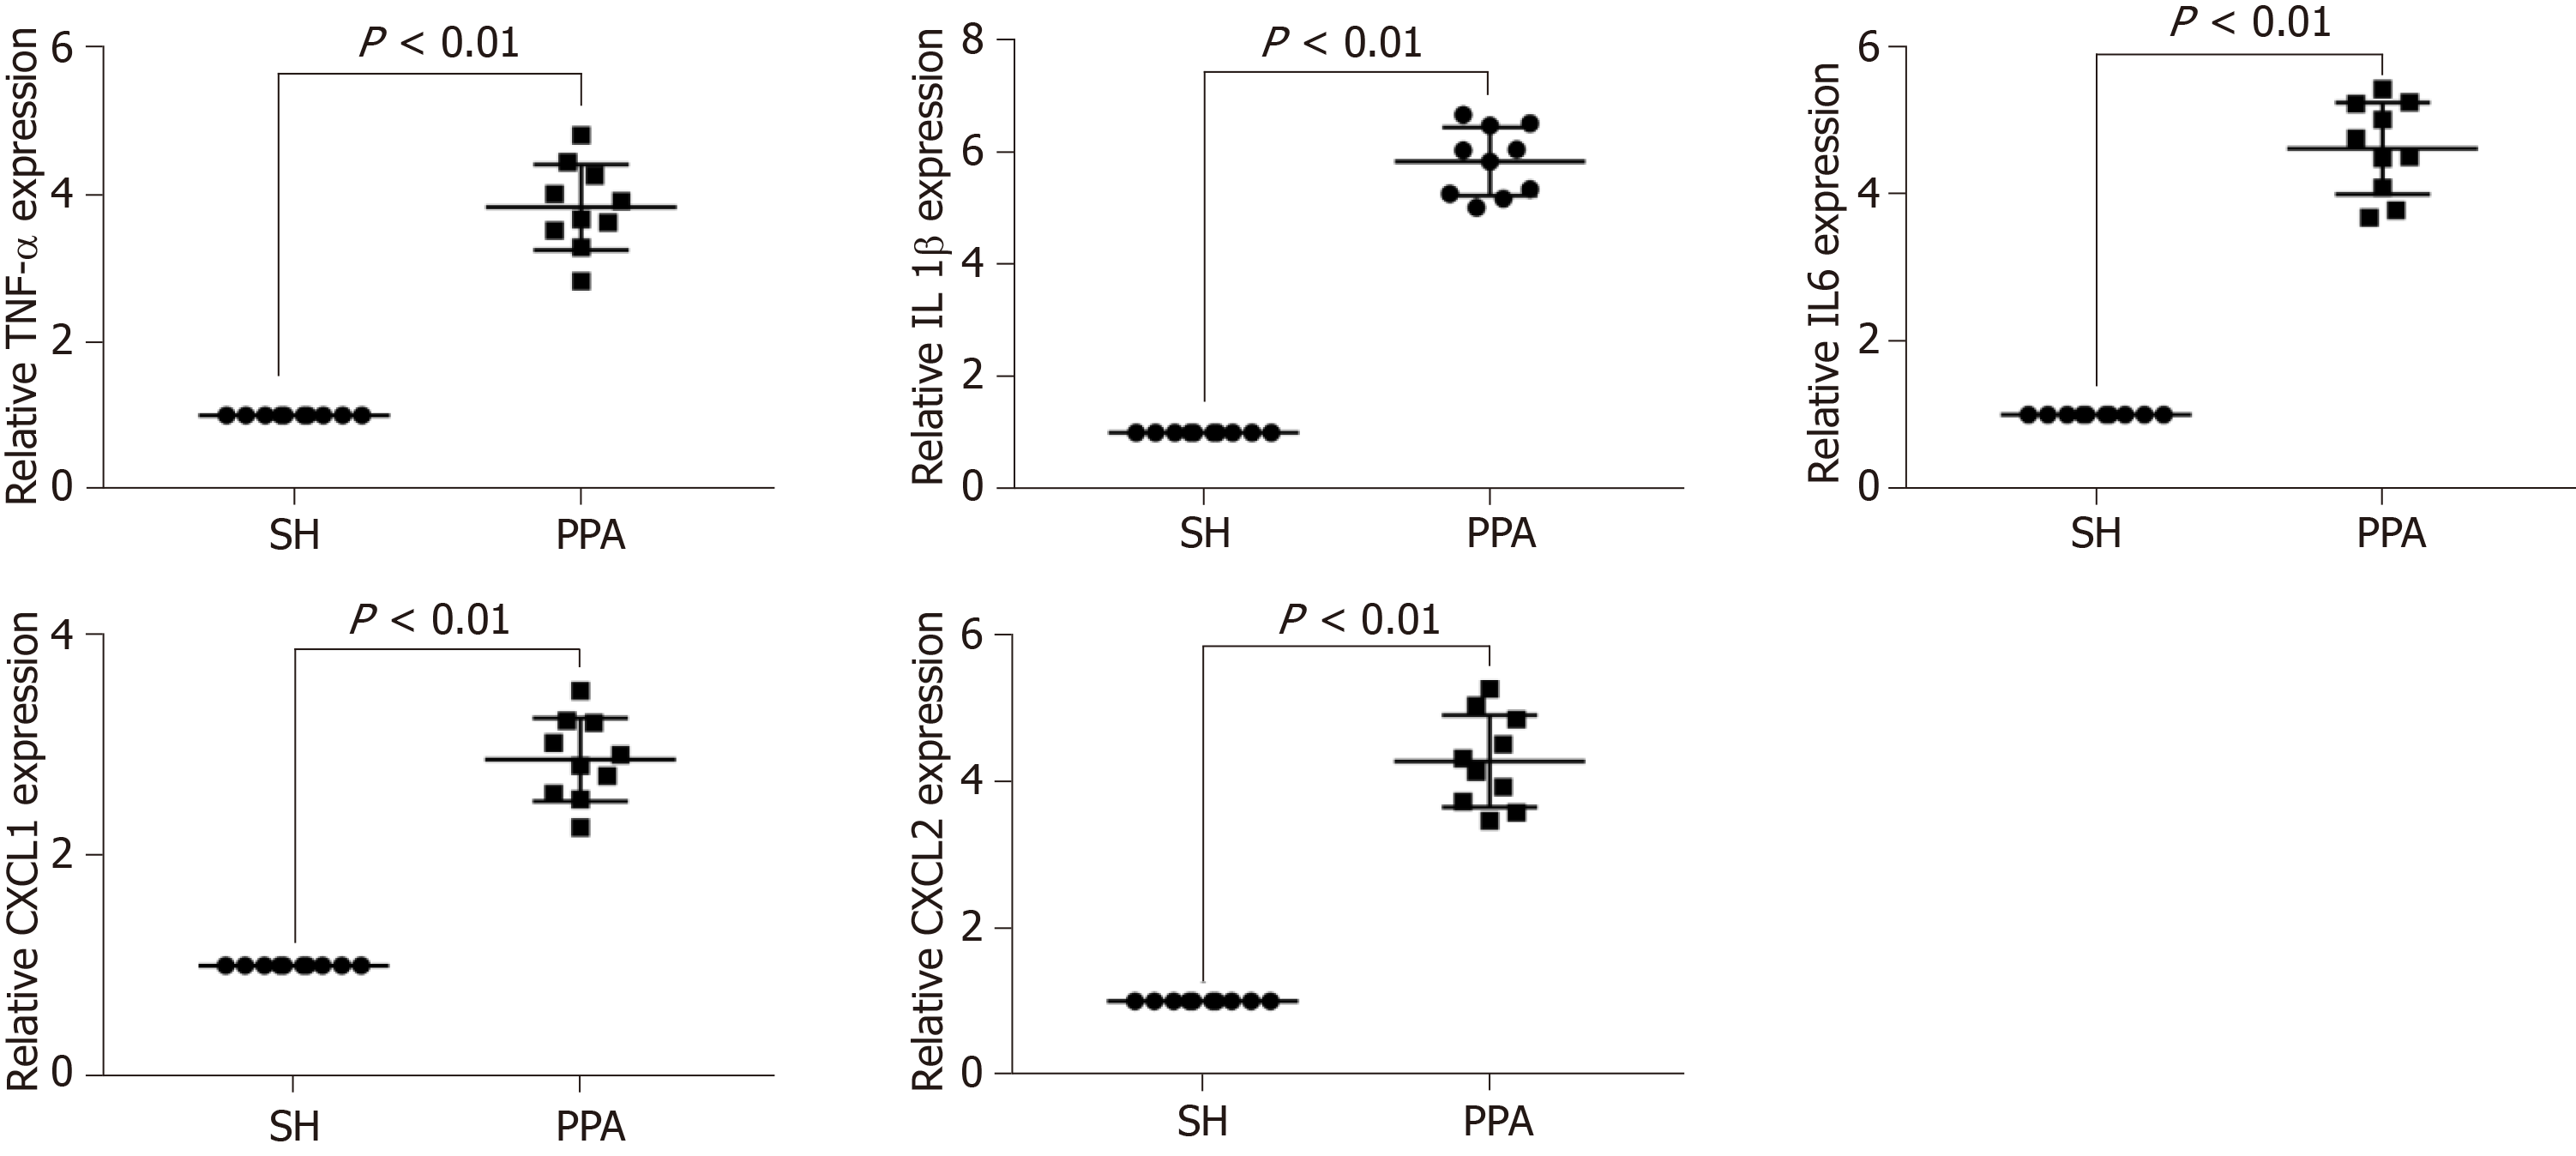
Figure 6 Representative mRNA expression level by qPCR.
Expression levels of the mRNAs (TNF-α, IL1β, IL6, CXCL1, and CXCL2) were performed using qPCR, results are expressed as mean ± SD. PPA: Postoperative peritoneal adhesion; SH: Sham.
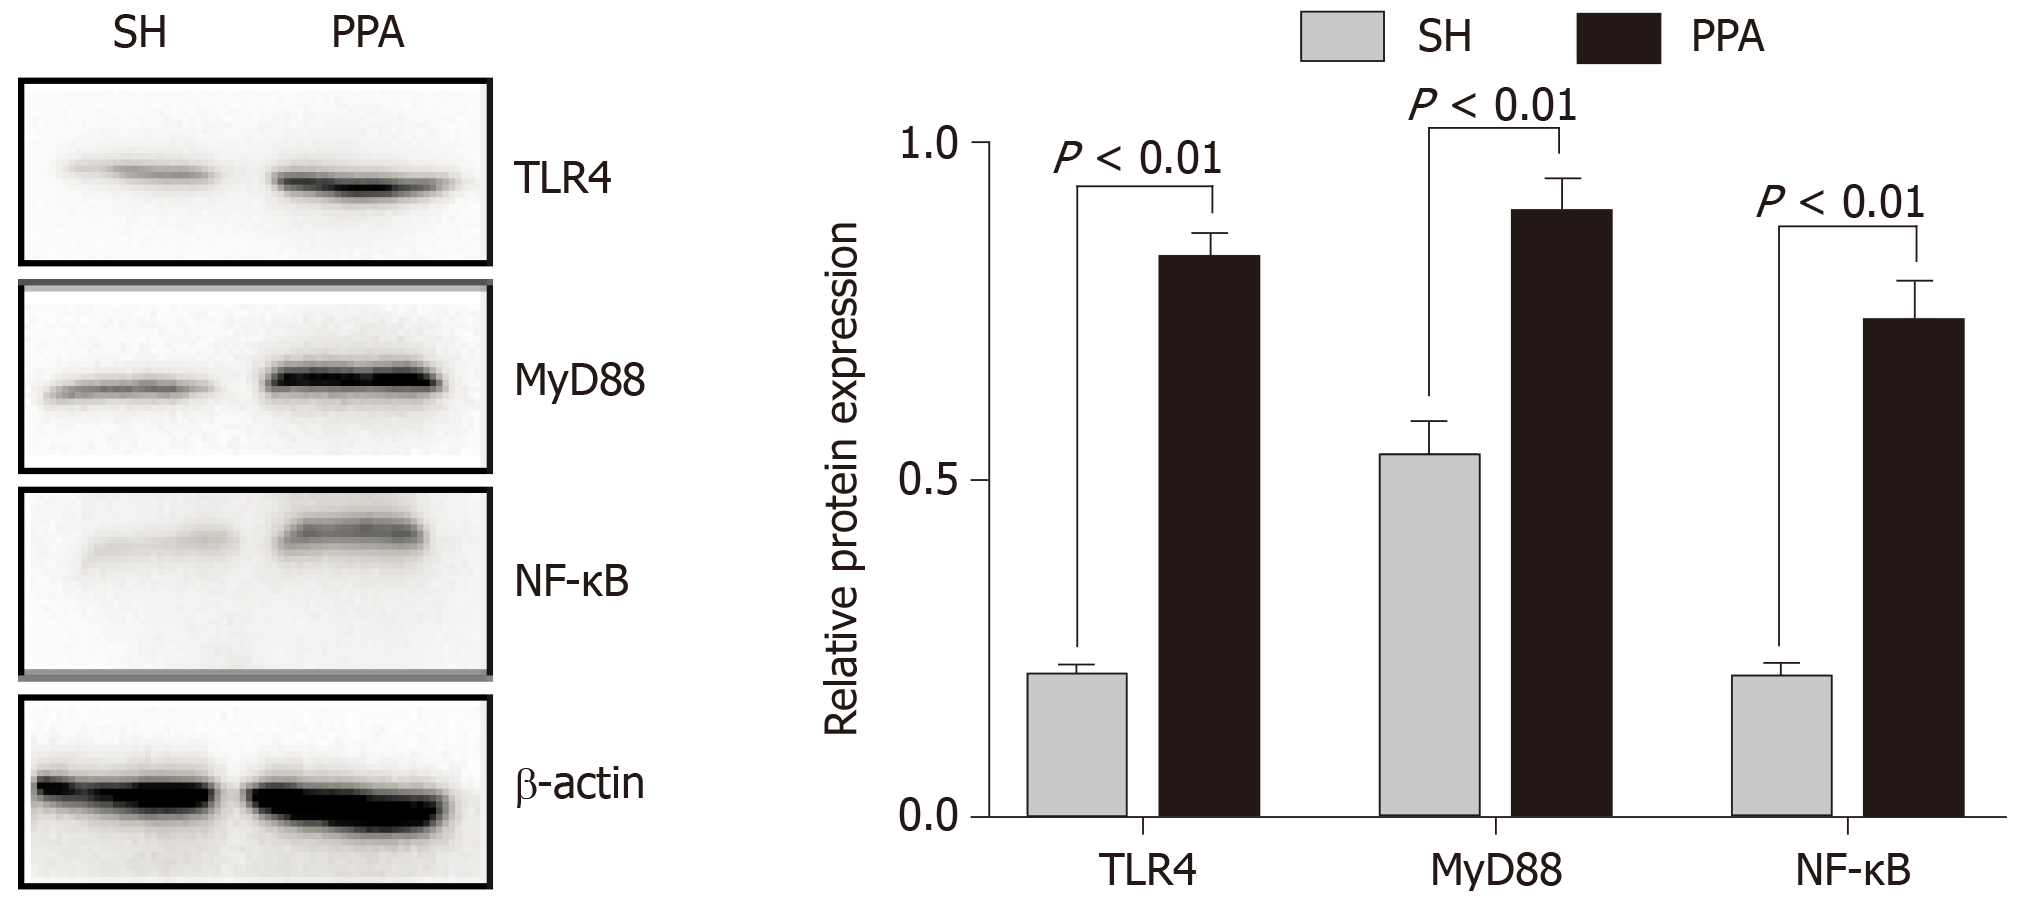
Figure 7 Relative protein levels by western blot analysis.
The expression levels of TLR4, MyD88, and NF-κB were obtained using western blot analysis. The results are expressed as mean ± SD. PPA: Postoperative peritoneal adhesion; SH: Sham.
- Citation: Bian YY, Yang LL, Yan Y, Zhao M, Chen YQ, Zhou YQ, Wang ZX, Li WL, Zeng L. Identification of candidate biomarkers correlated with pathogenesis of postoperative peritoneal adhesion by using microarray analysis. World J Gastrointest Oncol 2020; 12(1): 54-65
- URL: https://www.wjgnet.com/1948-5204/full/v12/i1/54.htm
- DOI: https://dx.doi.org/10.4251/wjgo.v12.i1.54


