Copyright
©The Author(s) 2019.
World J Gastrointest Oncol. Nov 15, 2019; 11(11): 1031-1042
Published online Nov 15, 2019. doi: 10.4251/wjgo.v11.i11.1031
Published online Nov 15, 2019. doi: 10.4251/wjgo.v11.i11.1031
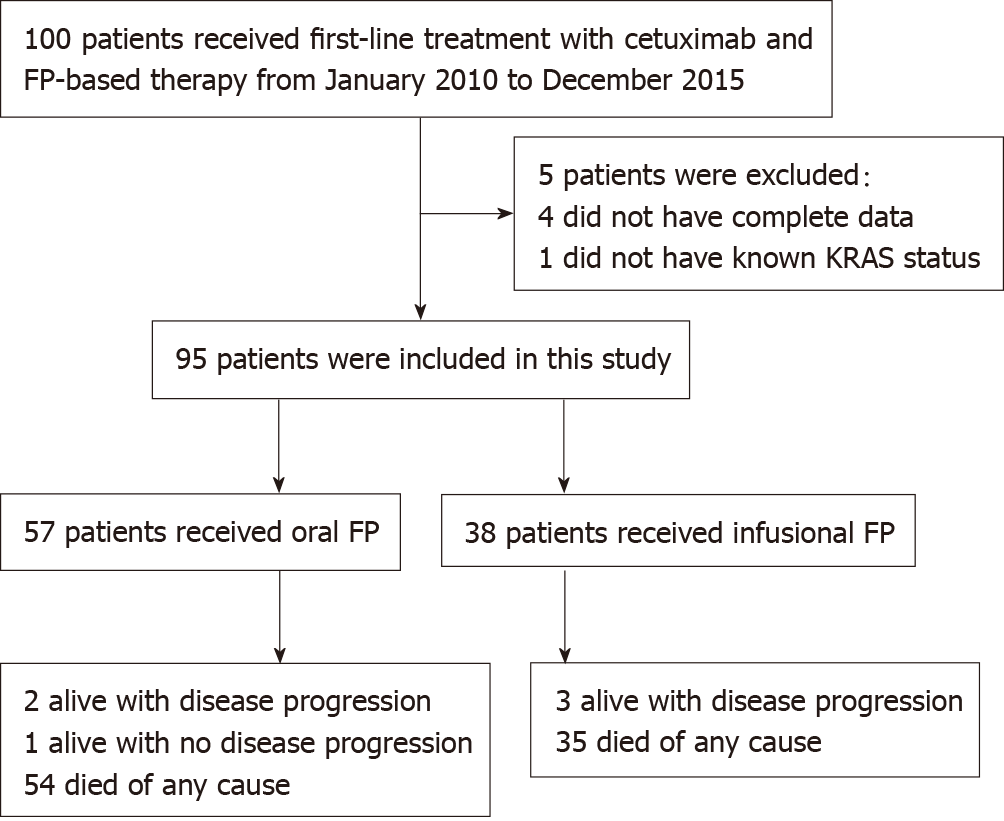
Figure 1 Study design.
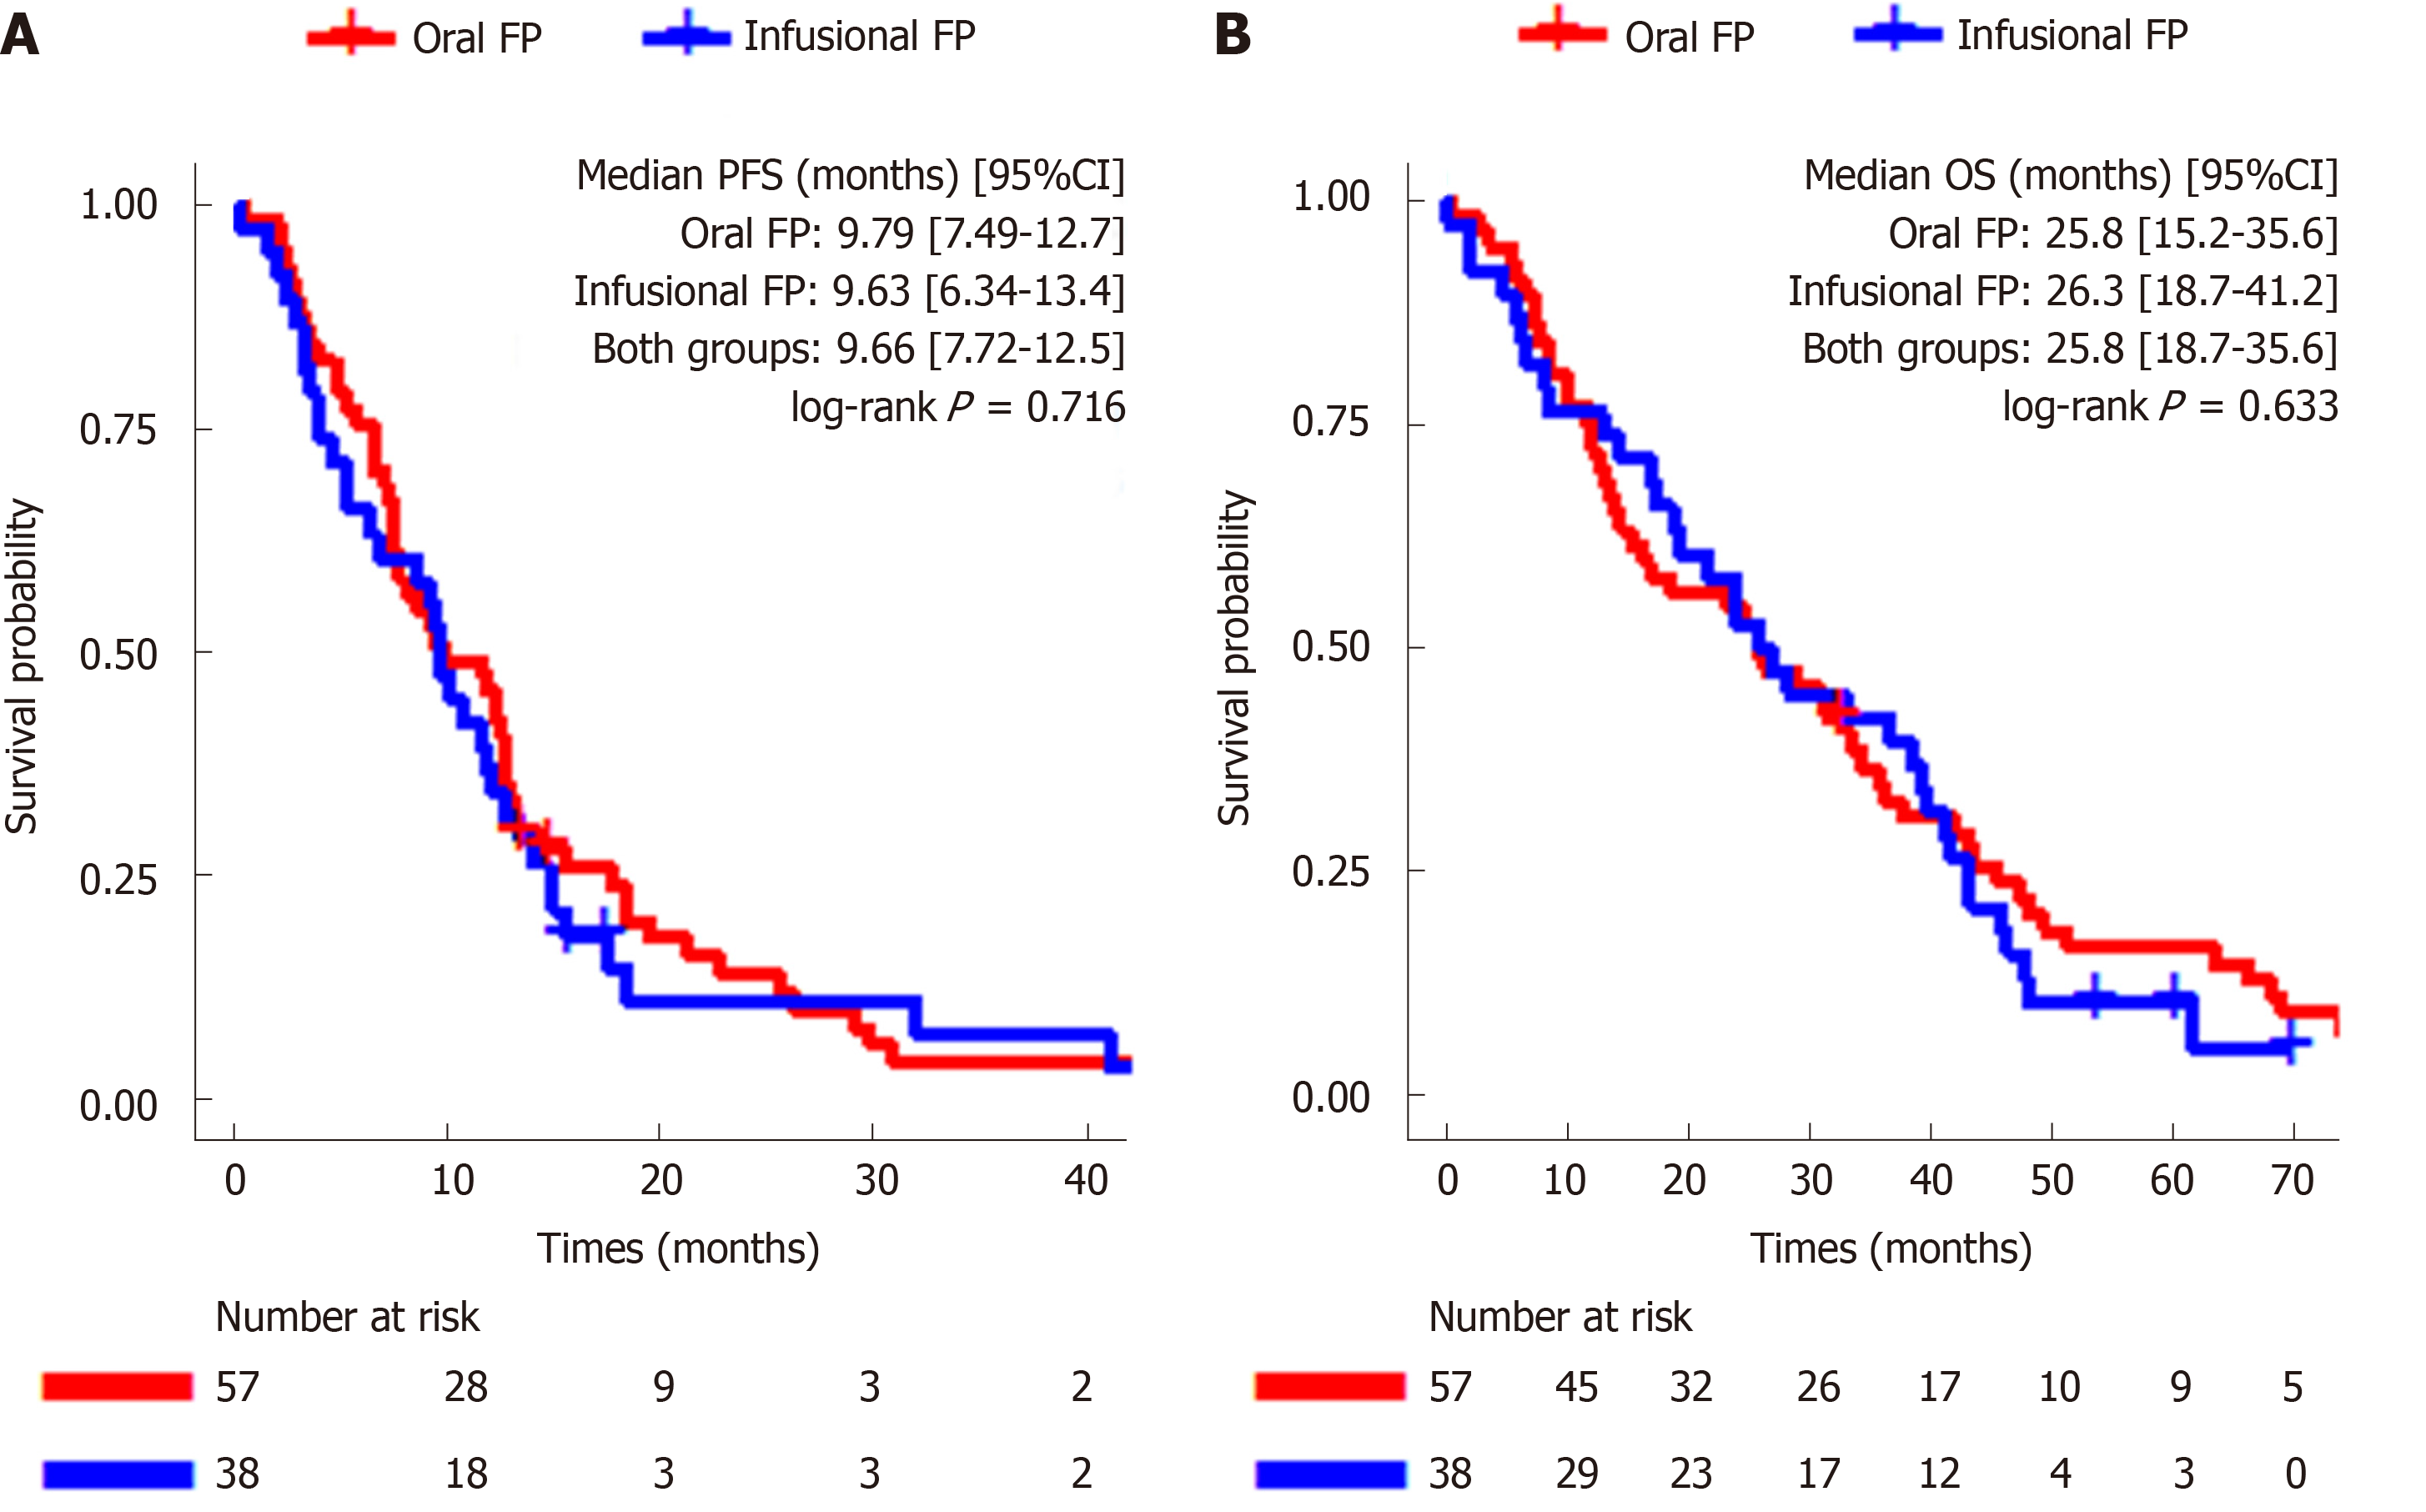
Figure 2 Kaplan-Meier curves for progression free survival (A, left) and overall survival (B, right) according to treatment groups.
A: The median progression free survival (mPFS) of the entire cohort was 9.66 mo (95%CI: 7.72–12.5) and there was no statistical difference in mPFS between the oral fluoropyrimidine (FP) group and infusional FP group [9.79 mo (95%CI: 7.49–12.7) vs 9.63 mo (95%CI: 6.34–13.4); log-rank P = 0.72]; B: The median overall survival (mOS) of the entire cohort was 25.8 mo (95%CI: 18.7–35.6) and there was no statistical difference between the oral FP group and infusional FP group [25.8 mo (95%CI: 15.2–35.6) vs 26.3 mo (95%CI: 18.7–41.2); log-rank P = 0.63].
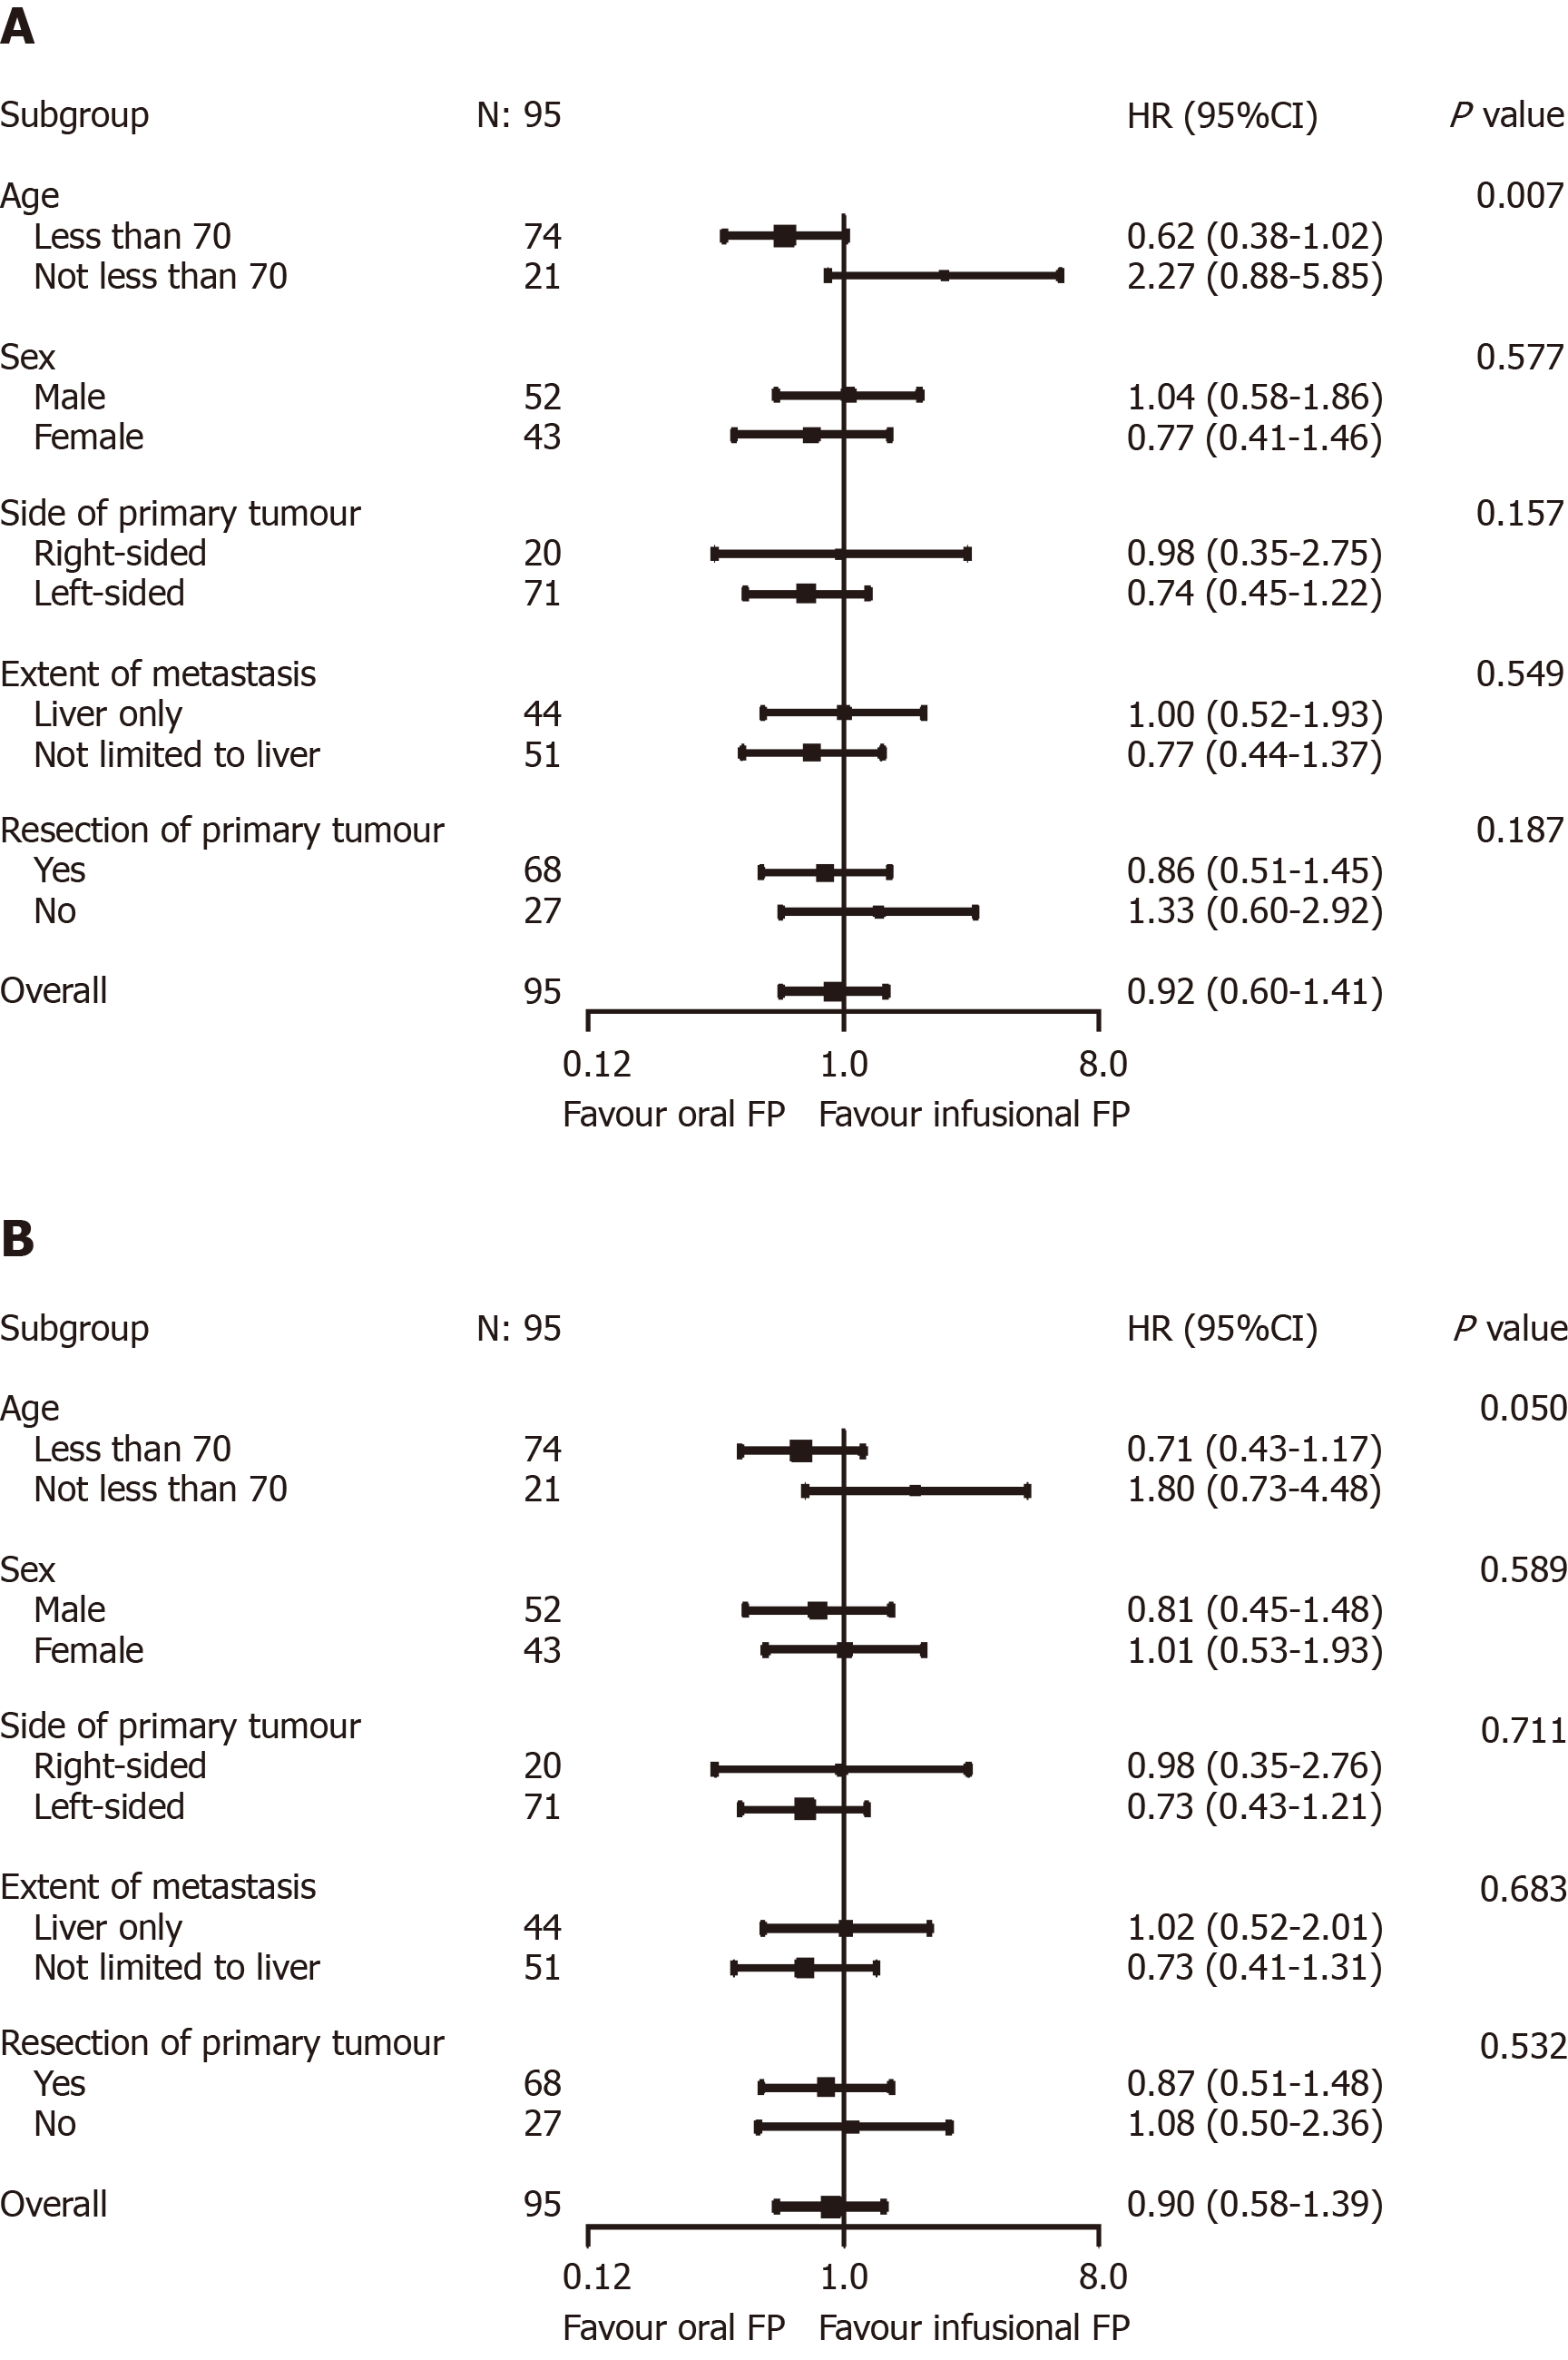
Figure 3 Exploratory predictive factor analyses for progression-free survival (A, above) and overall survival (B, below).
A: Age group was shown to modify the effects of chemotherapy backbone on progression-free survival (P = 0.007); B: A similar trend was observed in overall survival (P = 0.050).
- Citation: Lam KO, Fu MC, Lau KS, Lam KM, Choi CW, Chiu WH, Yuen CM, Kwok LH, Tam FK, Chan WL, Chan SY, Ho PY, Leung TW, Lee HF. Revisiting oral fluoropyrimidine with cetuximab in metastatic colorectal cancer: Real-world data in Chinese population. World J Gastrointest Oncol 2019; 11(11): 1031-1042
- URL: https://www.wjgnet.com/1948-5204/full/v11/i11/1031.htm
- DOI: https://dx.doi.org/10.4251/wjgo.v11.i11.1031


