Copyright
©The Author(s) 2017.
World J Gastrointest Endosc. Nov 16, 2017; 9(11): 540-551
Published online Nov 16, 2017. doi: 10.4253/wjge.v9.i11.540
Published online Nov 16, 2017. doi: 10.4253/wjge.v9.i11.540
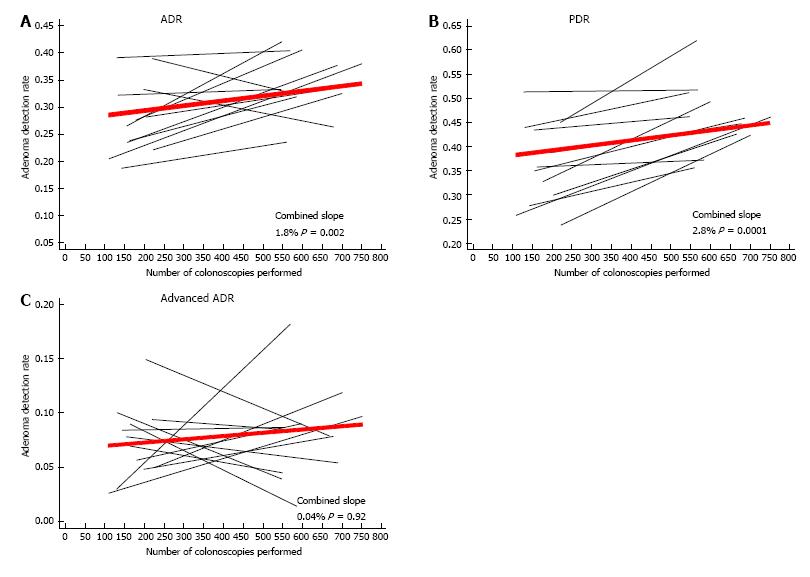
Figure 1 Individual and combined change trajectories of adenoma detection rate, polyp detection rate, and advanced adenoma detection rate for 12 fellows throughout their fellowship training.
A: ADR per rank; B: PDR; C: Advanced ADR. The black lines represent individual fellows and the red line represents the mean for the entire group of fellows. The numbers in the bottom right corner of each panel represent the slope (absolute percentage increase in outcome per 100 screening colonoscopies) and its associated P value. Models included the outcome, procedural volume (main exposure), and mean age, percentages of black patients, sex, and inadequate prep as time-varying predictors. ADR: Adenoma detection rate; PDR: Polyp detection rate.
- Citation: Qayed E, Vora R, Levy S, Bostick RM. Colonoscopy procedural volume increases adenoma and polyp detection rates in gastroenterologytrainees. World J Gastrointest Endosc 2017; 9(11): 540-551
- URL: https://www.wjgnet.com/1948-5190/full/v9/i11/540.htm
- DOI: https://dx.doi.org/10.4253/wjge.v9.i11.540


