
















©2012 Baishideng.
World J Gastrointest Endosc. Sep 16, 2012; 4(9): 387-397
Published online Sep 16, 2012. doi: 10.4253/wjge.v4.i9.387
Published online Sep 16, 2012. doi: 10.4253/wjge.v4.i9.387
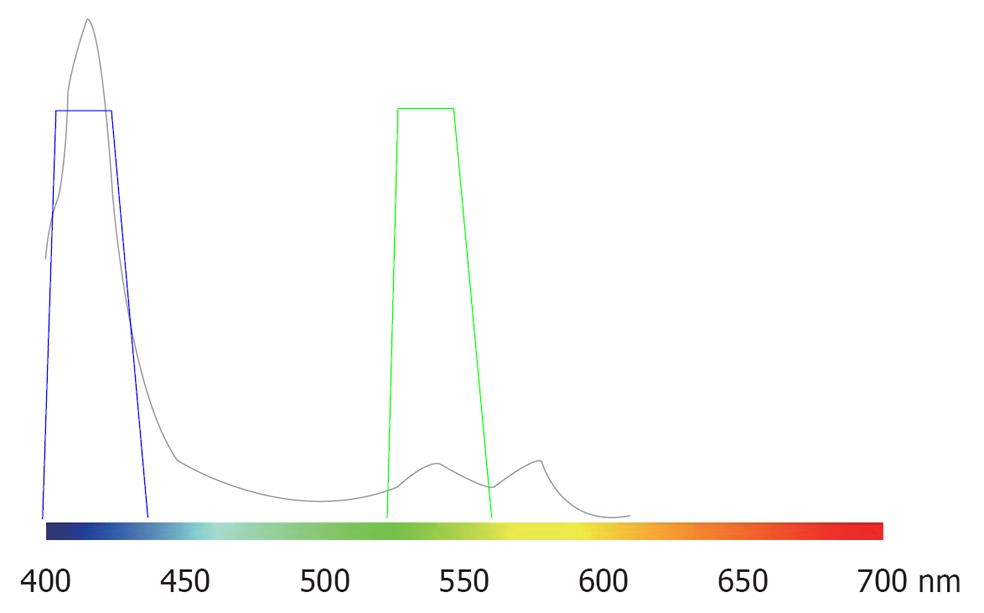
Figure 1 Light wavelength-related differences in hemoglobin absorption (hemoglobin absorption curve).
The transverse axis indicates the wavelength of visible light. The longitudinal axis indicates the absorption coefficient. The curve represents the relationship between the wavelength and hemoglobin absorption coefficient (provided from Olympus).
- Citation: Nonaka K, Nishimura M, Kita H. Role of narrow band imaging in endoscopic submucosal dissection. World J Gastrointest Endosc 2012; 4(9): 387-397
- URL: https://www.wjgnet.com/1948-5190/full/v4/i9/387.htm
- DOI: https://dx.doi.org/10.4253/wjge.v4.i9.387