Copyright
©The Author(s) 2025.
World J Gastrointest Endosc. Jun 16, 2025; 17(6): 107142
Published online Jun 16, 2025. doi: 10.4253/wjge.v17.i6.107142
Published online Jun 16, 2025. doi: 10.4253/wjge.v17.i6.107142
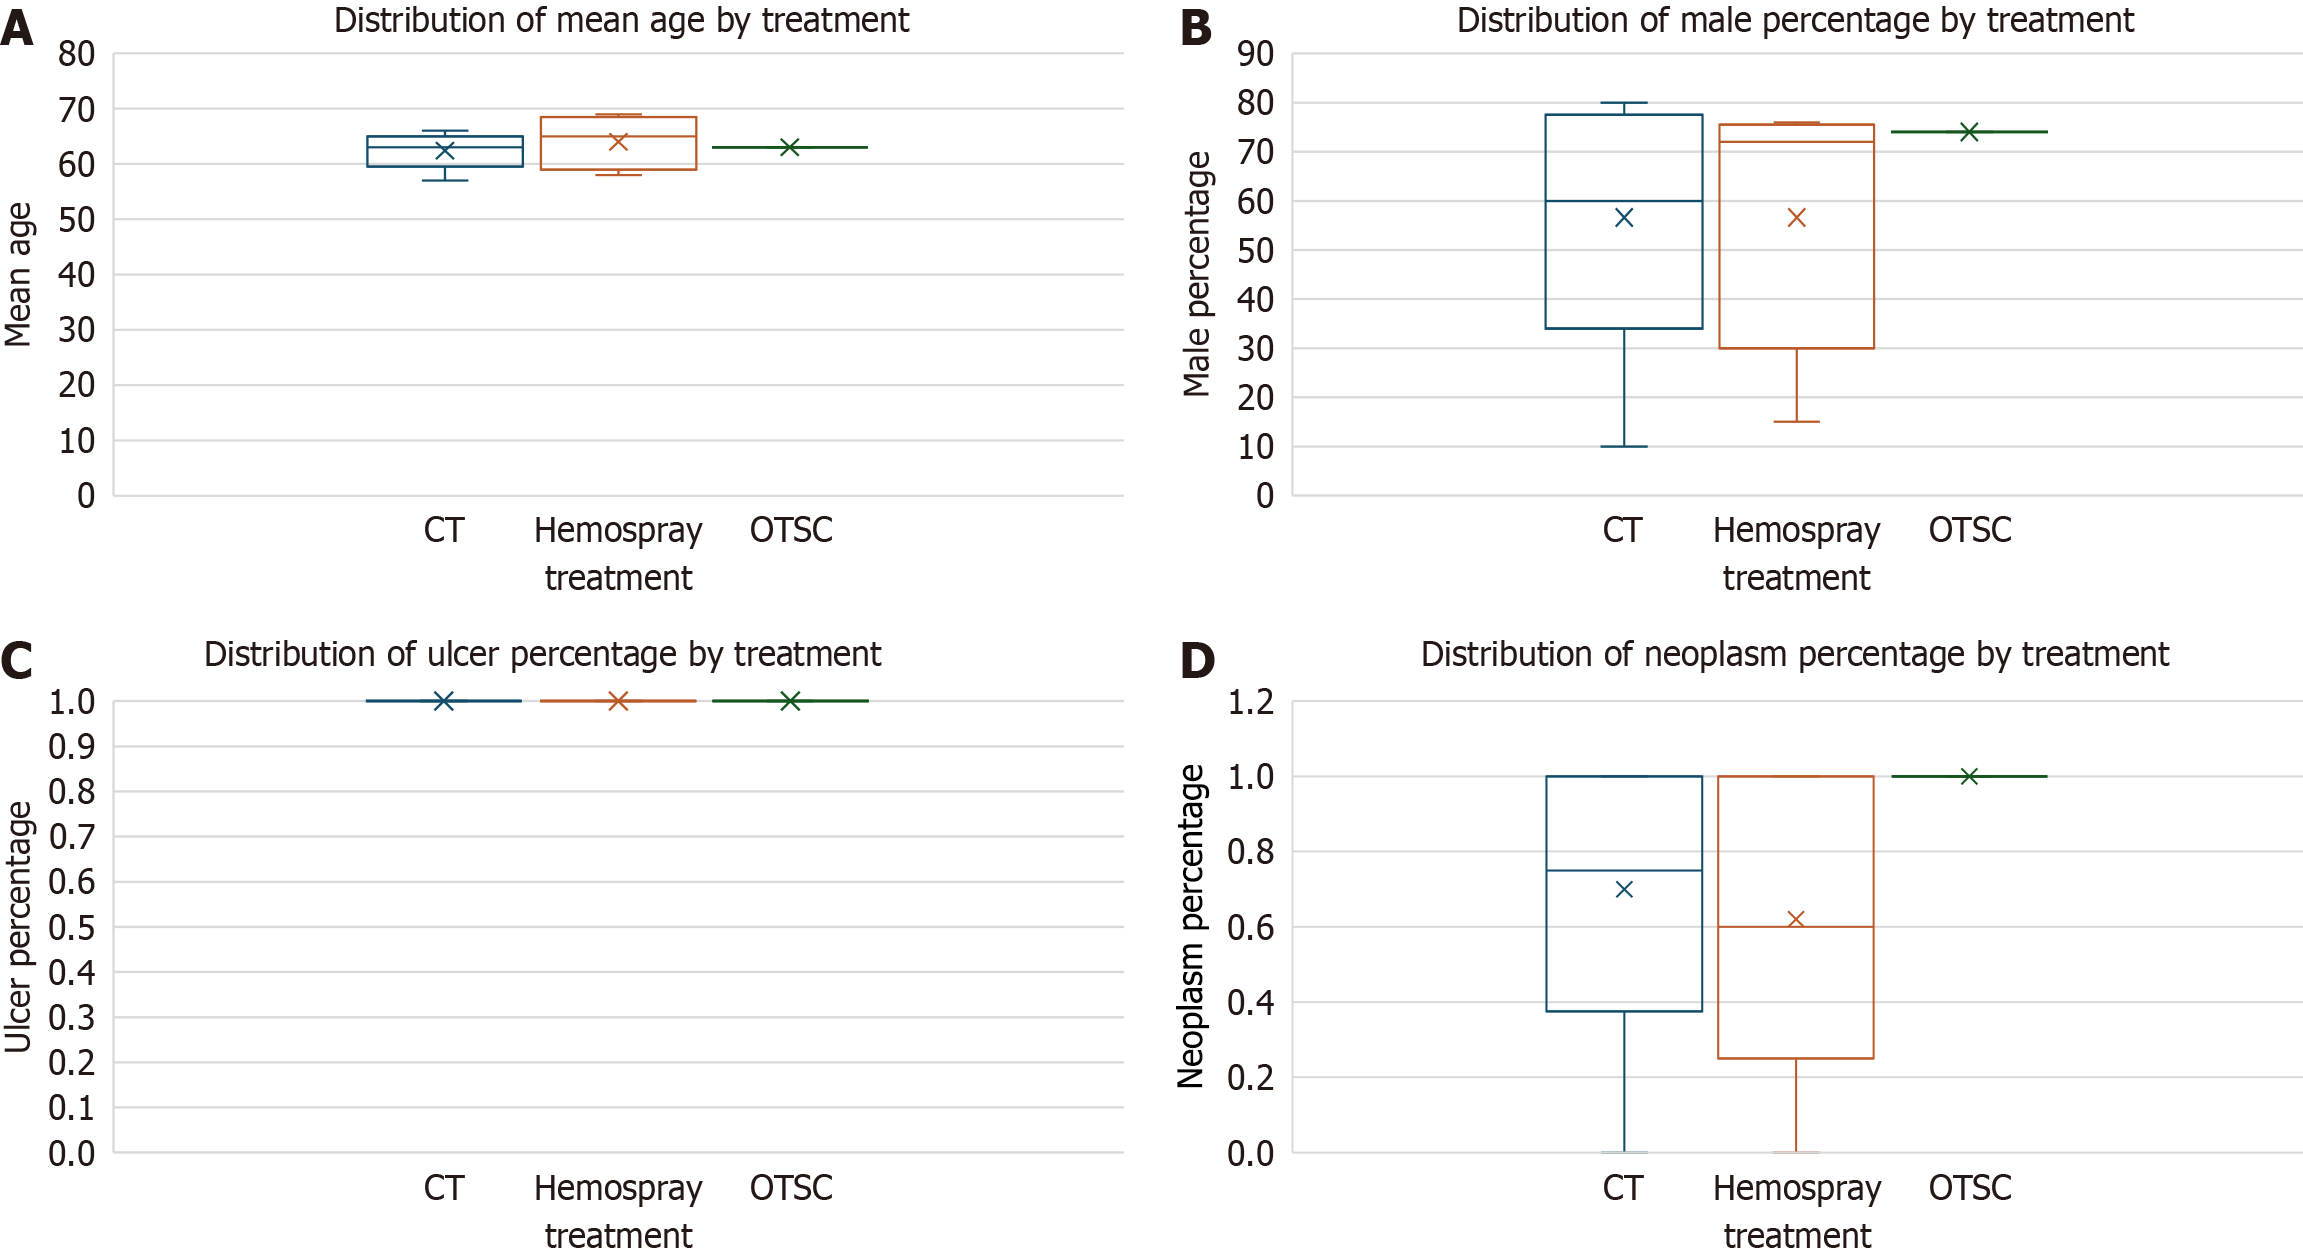
Figure 6 The boxplots show the distribution of key trial-level covariates (mean age, male percentage, ulcer percentage, and neoplasm percentage) across the treatments (over-the-scope clips, hemostatic powder, and computed tomography).
A: Mean age: Similar ranges across all treatment groups, indicating comparability; B: Male percentage: Slight differences but overlaps suggest transitivity is likely maintained; C: Ulcer percentage: Variability observed between groups; may need further exploration for potential impact; D: Neoplasm percentage: Differences between treatment groups could affect transitivity, especially if one treatment is more commonly applied in neoplasm-related cases. OTSC: Over-the-scope clips; HP: Hemostatic powder; CT: Computed tomography.
- Citation: Duggal S, Kalra I, Kalra K, Bhagat V. Advancing hemostasis: A meta-analysis of novel vs conventional endoscopic therapies for non variceal upper gastrointestinal bleeding. World J Gastrointest Endosc 2025; 17(6): 107142
- URL: https://www.wjgnet.com/1948-5190/full/v17/i6/107142.htm
- DOI: https://dx.doi.org/10.4253/wjge.v17.i6.107142


