Copyright
©The Author(s) 2025.
World J Gastrointest Endosc. Jun 16, 2025; 17(6): 107142
Published online Jun 16, 2025. doi: 10.4253/wjge.v17.i6.107142
Published online Jun 16, 2025. doi: 10.4253/wjge.v17.i6.107142
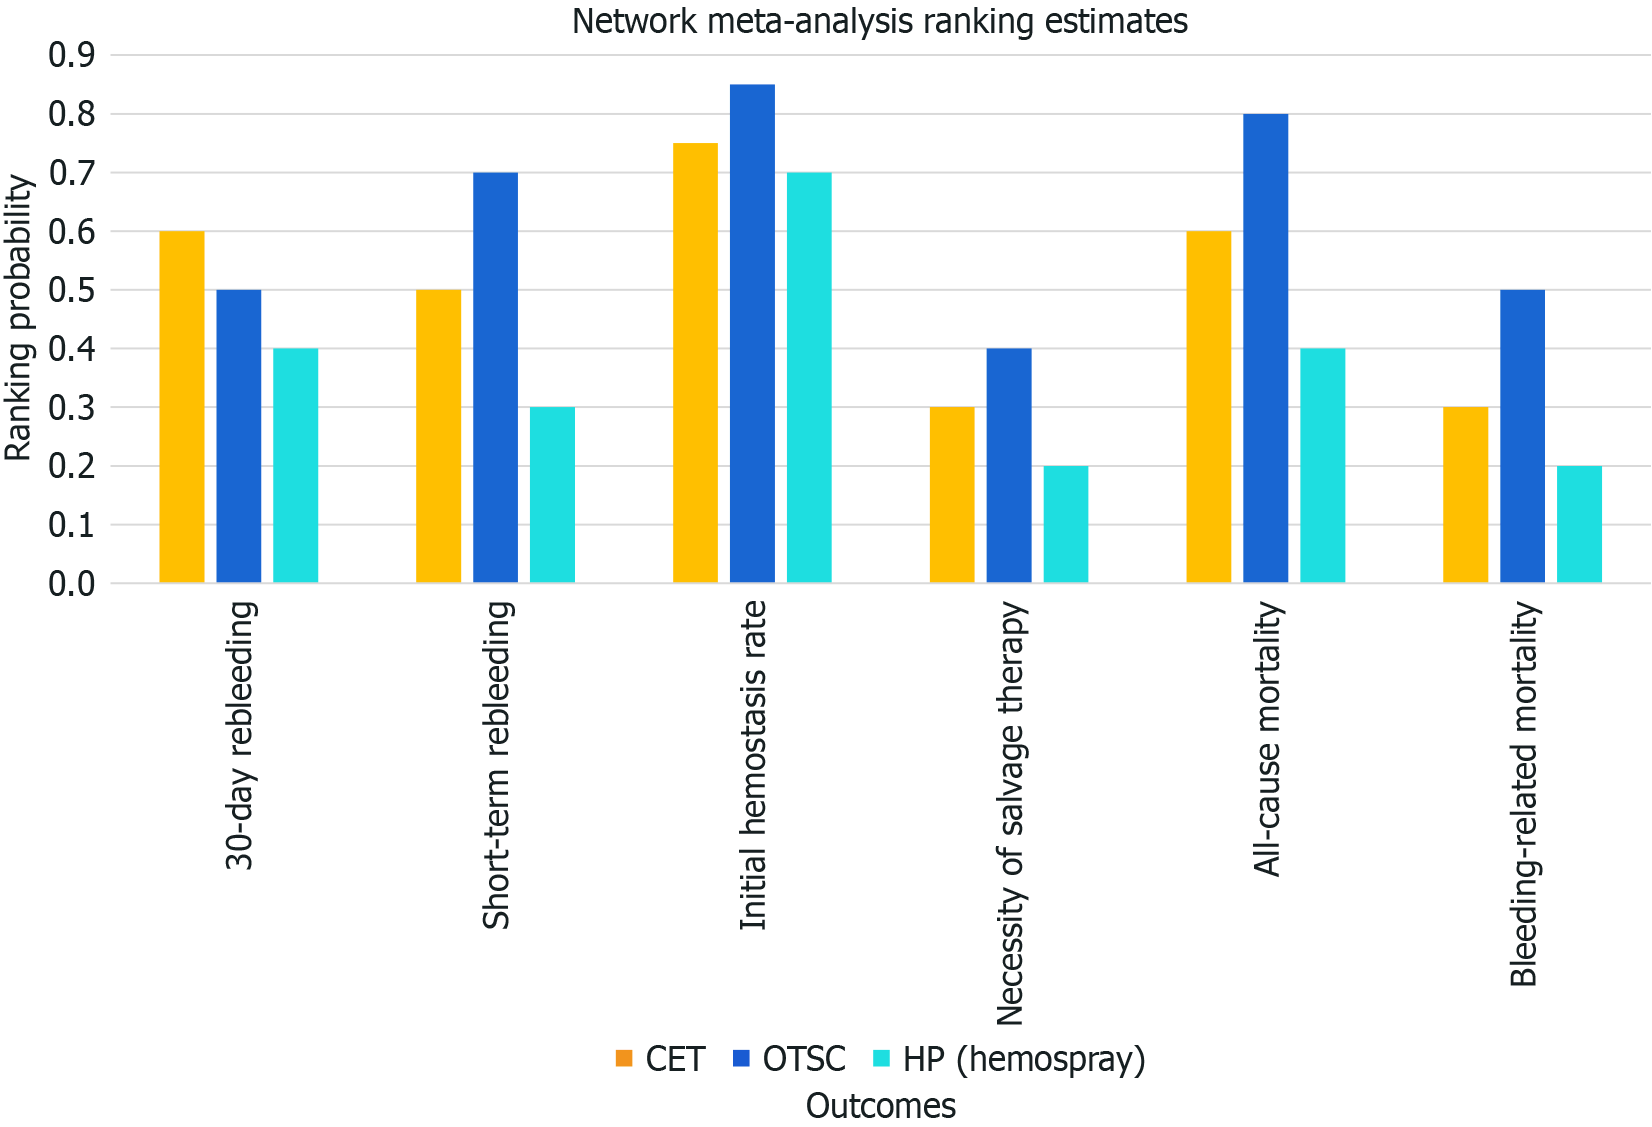
Figure 4 Displays the network meta-analysis ranking visualization, showing the ranking probabilities for treatments (computed tomo
- Citation: Duggal S, Kalra I, Kalra K, Bhagat V. Advancing hemostasis: A meta-analysis of novel vs conventional endoscopic therapies for non variceal upper gastrointestinal bleeding. World J Gastrointest Endosc 2025; 17(6): 107142
- URL: https://www.wjgnet.com/1948-5190/full/v17/i6/107142.htm
- DOI: https://dx.doi.org/10.4253/wjge.v17.i6.107142


