Copyright
©The Author(s) 2017.
World J Hepatol. Mar 8, 2017; 9(7): 368-384
Published online Mar 8, 2017. doi: 10.4254/wjh.v9.i7.368
Published online Mar 8, 2017. doi: 10.4254/wjh.v9.i7.368
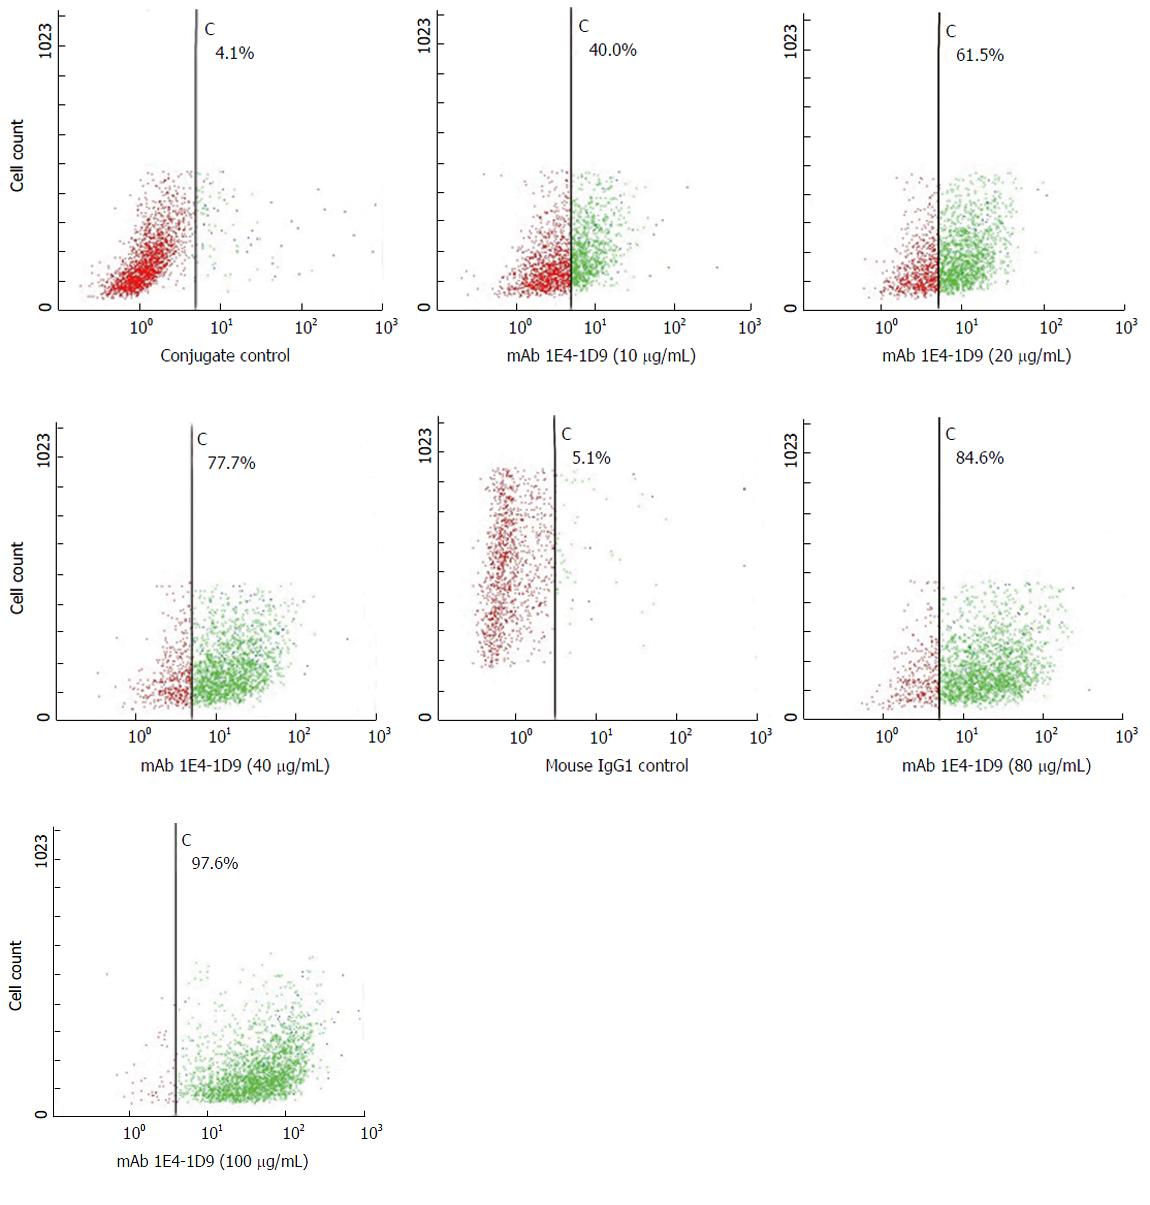
Figure 2 HepG2 cells (4 × 10⁵ cells/mL) were reacted with various final concentrations of mAb 1E4-1D9 (0-160 µg/mL) for 30 min on ice.
Mouse IgG1 was used as isotype control. After washing, cells were stained with fluorescein isothiocyanate-conjugated rabbit anti-mouse Igs (1:20) for 30 min on ice and washed. Finally, cells were suspended with 300 μL of 0.5% paraformaldehyde in phosphate buffered saline, pH 7.2 and analyzed by flow cytometry.
- Citation: Vongchan P, Linhardt RJ. Characterization of a new monoclonal anti-glypican-3 antibody specific to the hepatocellular carcinoma cell line, HepG2. World J Hepatol 2017; 9(7): 368-384
- URL: https://www.wjgnet.com/1948-5182/full/v9/i7/368.htm
- DOI: https://dx.doi.org/10.4254/wjh.v9.i7.368


