Copyright
©The Author(s) 2017.
World J Hepatol. Jan 28, 2017; 9(3): 161-166
Published online Jan 28, 2017. doi: 10.4254/wjh.v9.i3.161
Published online Jan 28, 2017. doi: 10.4254/wjh.v9.i3.161
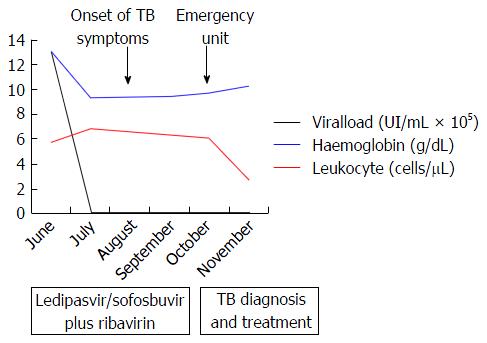
Figure 4 Course of haemoglobin, leucocytes and viral load during and after antiviral treatment.
Attendance to the emergency unit, tuberculosis diagnosis and start of therapy are shown according to time. TB: Tuberculosis.
- Citation: Ballester-Ferré MP, Martínez F, Garcia-Gimeno N, Mora F, Serra MA. Miliary tuberculosis infection during hepatitis C treatment with sofosbuvir and ledipasvir plus ribavirin. World J Hepatol 2017; 9(3): 161-166
- URL: https://www.wjgnet.com/1948-5182/full/v9/i3/161.htm
- DOI: https://dx.doi.org/10.4254/wjh.v9.i3.161


