Copyright
©The Author(s) 2017.
World J Hepatol. Sep 8, 2017; 9(25): 1073-1080
Published online Sep 8, 2017. doi: 10.4254/wjh.v9.i25.1073
Published online Sep 8, 2017. doi: 10.4254/wjh.v9.i25.1073
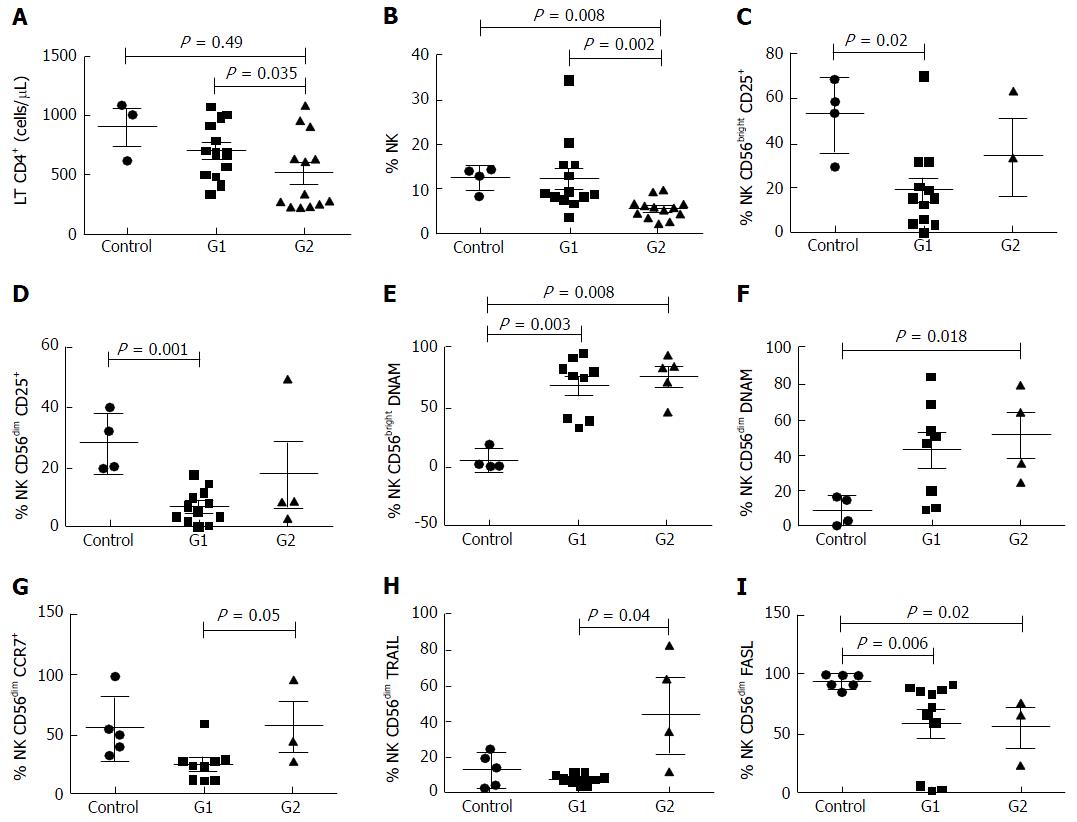
Figure 2 Differences between groups 1, 2 and controls regarding.
A: Total CD4 cell count; B: Percent of NK cells; C: Percent NK CD56bright CD25+; D: Percent CD56dim CD25+ NK cells; E: Percent CD56bright DNAM+ NK cells; F: Percent CD56dim DNAM+ NK cells; G: Percent CD56dim CCR7+ NK cells; H: Percent CD56dim TRAIL+ NK cells; I: Percent CD56dim FasL+ NK cells. The P values are shown in each graphic and the line below the P value connects the two groups compared. NK: Natural killer.
- Citation: Laufer N, Ojeda D, Polo ML, Martinez A, Pérez H, Turk G, Cahn P, Zwirner NW, Quarleri J. CD4+ T cells and natural killer cells: Biomarkers for hepatic fibrosis in human immunodeficiency virus/hepatitis C virus-coinfected patients. World J Hepatol 2017; 9(25): 1073-1080
- URL: https://www.wjgnet.com/1948-5182/full/v9/i25/1073.htm
- DOI: https://dx.doi.org/10.4254/wjh.v9.i25.1073


