Copyright
©The Author(s) 2016.
World J Hepatol. Feb 18, 2016; 8(5): 282-290
Published online Feb 18, 2016. doi: 10.4254/wjh.v8.i5.282
Published online Feb 18, 2016. doi: 10.4254/wjh.v8.i5.282
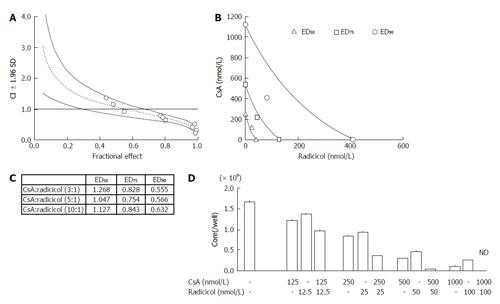
Figure 6 Analysis of the synergistic effect of cyclosporin A and radicicol.
A: The graphs were constructed using the Chou and Talalay method. The CI and the fractional effect were derived from the release of the HCV core protein into the culture medium of JFH1-infected Huh-7 cells that were treated with a combination of CsA and radicicol (5:1 molar ratio). The open circles indicate actual experimental data. The CI vs fractional effect plots were generated with CalcSyn software. The dotted line and solid lines represent the mean values and standard deviation (1.96), respectively, of three independent experiments. The CI < 1, CI = 1, and CI > 1 indicate synergy, an additive effect and antagonism, respectively; B: The conservation isobologram (CI = 1) depicting different effective doses that yielded 50% (ED50), 75% (ED75) and 90% (ED90) inhibition of viral release by the combination treatment was graphed with actual experimental data (ED50, open triangles; ED75, open squares; ED90, open circles). The data represent the mean values of the results from three independent experiments; C: The CI values of each ED50, ED75 and ED90 by the combined CsA and radicicol treatment at molar ratios of 3:1, 5:1 and 10:1, respectively; D: The combined effect of CsA and radicicol at a molar ratio of 10:1. The HCV core levels in the medium are shown. The mean values and standard deviation (± SD) of the amounts of the HCV core released into the medium during three independent experiments are shown. The concentrations used in each set of experiments are shown under the histogram. ND: Not detected; CsA: Cyclosporin A; HCV: Hepatitis C virus; CI: Combination index.
- Citation: Kubota N, Nomoto M, Hwang GW, Watanabe T, Kohara M, Wakita T, Naganuma A, Kuge S. Hepatitis C virus inhibitor synergism suggests multistep interactions between heat-shock protein 90 and hepatitis C virus replication. World J Hepatol 2016; 8(5): 282-290
- URL: https://www.wjgnet.com/1948-5182/full/v8/i5/282.htm
- DOI: https://dx.doi.org/10.4254/wjh.v8.i5.282


