















©The Author(s) 2016.
World J Hepatol. Dec 28, 2016; 8(36): 1629-1636
Published online Dec 28, 2016. doi: 10.4254/wjh.v8.i36.1629
Published online Dec 28, 2016. doi: 10.4254/wjh.v8.i36.1629
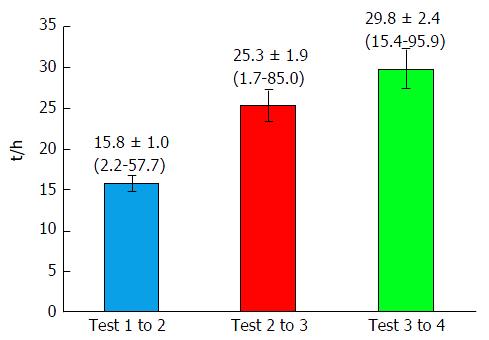
Figure 2 Time intervals between serological liver tests (hours).
Time interval data in hours, are shown as means. Means ± SDs, and ranges (i.e., minima to maxima), above the bars.
- Citation: Resnick E, Shteingart S, Melamud B, Bdolah-Abram T, Zalut T, Reuben A, Lurie Y. Enzyme pattern of biliary colic: A counterintuitive picture. World J Hepatol 2016; 8(36): 1629-1636
- URL: https://www.wjgnet.com/1948-5182/full/v8/i36/1629.htm
- DOI: https://dx.doi.org/10.4254/wjh.v8.i36.1629