Copyright
©The Author(s) 2016.
World J Hepatol. Oct 8, 2016; 8(28): 1194-1199
Published online Oct 8, 2016. doi: 10.4254/wjh.v8.i28.1194
Published online Oct 8, 2016. doi: 10.4254/wjh.v8.i28.1194
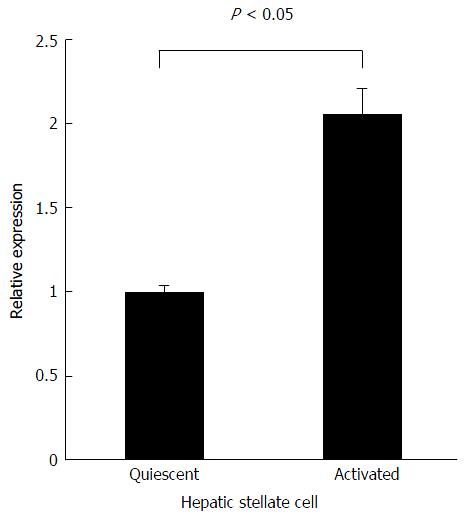
Figure 4 Relative Agtr1a expression normalized to Ppia in quiescent and activated hepatic stellate cells.
Activated hepatic stellate cells (HSCs) show 2.2-fold higher (P < 0.05) Agtr1a expression than that shown by quiescent HSCs. Data are presented as the mean ± SE.
- Citation: Asada K, Aihara Y, Takaya H, Noguchi R, Namisaki T, Moriya K, Uejima M, Kitade M, Mashitani T, Takeda K, Kawaratani H, Okura Y, Kaji K, Douhara A, Sawada Y, Nishimura N, Seki K, Mitoro A, Yamao J, Yoshiji H. DNA methylation of angiotensin II receptor gene in nonalcoholic steatohepatitis-related liver fibrosis. World J Hepatol 2016; 8(28): 1194-1199
- URL: https://www.wjgnet.com/1948-5182/full/v8/i28/1194.htm
- DOI: https://dx.doi.org/10.4254/wjh.v8.i28.1194


