Copyright
©The Author(s) 2016.
World J Hepatol. Sep 18, 2016; 8(26): 1110-1115
Published online Sep 18, 2016. doi: 10.4254/wjh.v8.i26.1110
Published online Sep 18, 2016. doi: 10.4254/wjh.v8.i26.1110
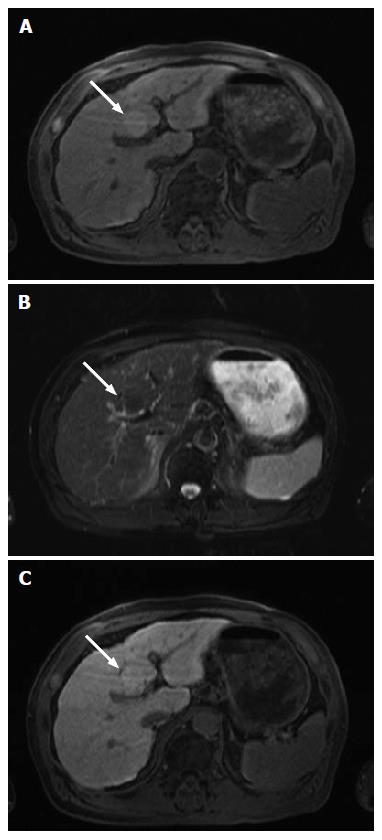
Figure 3 Magnetic resonance imaging.
Magnetic resonance imaging (MRI) demonstrated slightly high intensity in T1 weighted image (A, arrow), and slightly low intensity in T2 weighted image (B, arrow). Contrast-enhanced MRI using Gd-EOB-DTPA revealed slightly high intensity in the hepatobiliary phase (C, arrow). Gd-EOB-DTPA: Gadolinium ethoxybenzyl diethylene triamine pentaacetic acid.
- Citation: Kumagawa M, Matsumoto N, Watanabe Y, Hirayama M, Miura T, Nakagawara H, Ogawa M, Matsuoka S, Moriyama M, Takayama T, Sugitani M. Contrast-enhanced ultrasonographic findings of serum amyloid A-positive hepatocellular neoplasm: Does hepatocellular adenoma arise in cirrhotic liver? World J Hepatol 2016; 8(26): 1110-1115
- URL: https://www.wjgnet.com/1948-5182/full/v8/i26/1110.htm
- DOI: https://dx.doi.org/10.4254/wjh.v8.i26.1110


