Copyright
©The Author(s) 2016.
World J Hepatol. Aug 18, 2016; 8(23): 994-998
Published online Aug 18, 2016. doi: 10.4254/wjh.v8.i23.994
Published online Aug 18, 2016. doi: 10.4254/wjh.v8.i23.994
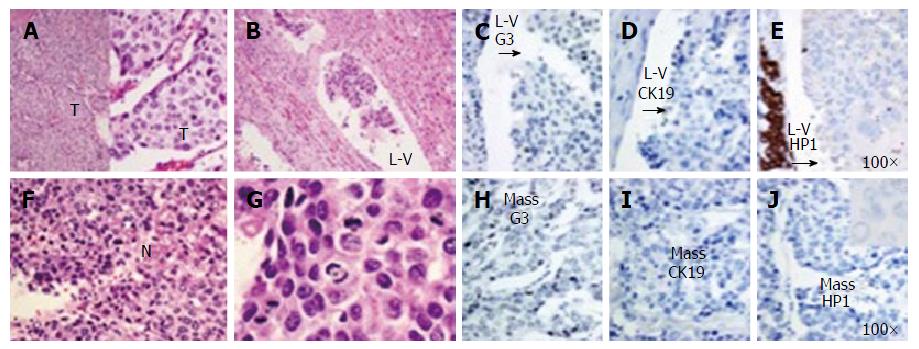
Figure 2 Initial hepatic lobectomy.
On the left-hand set of H and E-stained quarter panel images, the upper left two-image combination quarter panel (A) shows the trabecular architecture, the trabeculae as “T”; the upper right H and E quarter panel (B) shows L-V; the lower H and E quarter panels show high power views of solid pattern tumor with focal geographic necrosis [lower left (F) as “N”] and numerous mitoses [lower right (G) with “M” times 4]; on the right-hand set of IHC-stained split full-height images, the mass, along the bottom (H-J) show negative G3 (H), CK19 (I), HP1 (J); the L-V, along the top (C-E) with a similar pattern, but with weak but convincing HP1 positivity. Both HP1 stains are inset with 100 × high power images (100 ×). Arrows on the L-V IHC (C and D) stains indicate the tumor (opposite vessel wall). L-V: Lymph-vascular tumor; Mass: Main mass; LN: Lymph node; G3: Glypican 3; CK19: Cytokeratin 19; HP1: Hepatocyte paraffin 1; T: Tumor.
- Citation: Caparelli ML, Roberts NJ, Braverman TS, Stevens RM, Broun ER, Allamaneni S. Metastatic recurrence to a solitary lymph node four years after hepatic lobectomy for primary hepatocellular carcinoma. World J Hepatol 2016; 8(23): 994-998
- URL: https://www.wjgnet.com/1948-5182/full/v8/i23/994.htm
- DOI: https://dx.doi.org/10.4254/wjh.v8.i23.994


