Copyright
©The Author(s) 2016.
World J Hepatol. Aug 8, 2016; 8(22): 933-941
Published online Aug 8, 2016. doi: 10.4254/wjh.v8.i22.933
Published online Aug 8, 2016. doi: 10.4254/wjh.v8.i22.933
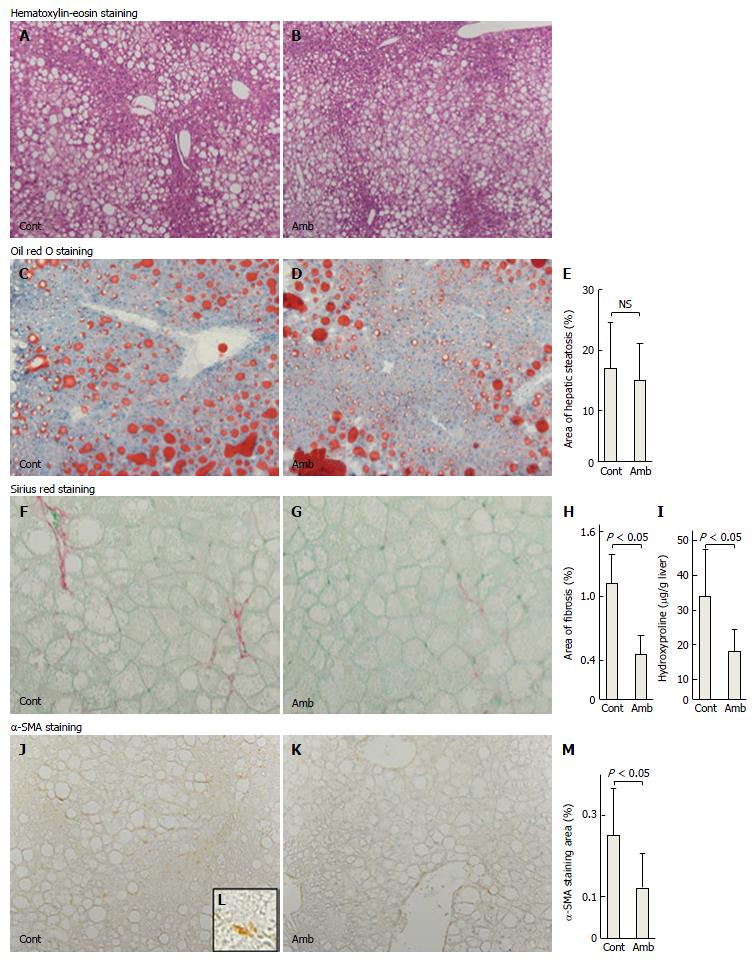
Figure 1 Histological analyses of liver tissues.
Representative images of hematoxylin-eosin staining (magnification, × 100) in the (A) control and (B) ambrisentan groups; representative images of oil red O staining (magnification, × 100) in the (C) control and (D) ambrisentan groups; E: The proportion (%) of the hepatic steatosis area stained with oil red O was measured using image analysis. Hepatic fibrosis was determined by Sirius red staining. Representative images of Sirius red staining (magnification, × 400) of the (F) control and (G) ambrisentan groups; the proportion (%) of the hepatic fibrosis area stained with Sirius red was measured using image analysis (P < 0.01); H: The area of fibrosis was significantly decreased in the ambrisentan group compared with the control group; I: Comparison of hepatic hydroxyproline content between groups; representative images of α-SMA immunostaining (magnification, × 400) in the (J) control and (K) ambrisentan groups; L: Shows a higher magnification (× 1000) of an α-SMA-positive cell (arrow); M: Quantitation of an area of α-SMA immunostaining measured by image analysis (P < 0.05). The area of α-SMA immunostaining was significantly reduced in the ambrisentan group compared with the control. α-SMA: α-smooth muscle actin.
- Citation: Okamoto T, Koda M, Miyoshi K, Onoyama T, Kishina M, Matono T, Sugihara T, Hosho K, Okano J, Isomoto H, Murawaki Y. Antifibrotic effects of ambrisentan, an endothelin-A receptor antagonist, in a non-alcoholic steatohepatitis mouse model. World J Hepatol 2016; 8(22): 933-941
- URL: https://www.wjgnet.com/1948-5182/full/v8/i22/933.htm
- DOI: https://dx.doi.org/10.4254/wjh.v8.i22.933


