Copyright
©The Author(s) 2016.
World J Hepatol. Jun 8, 2016; 8(16): 673-684
Published online Jun 8, 2016. doi: 10.4254/wjh.v8.i16.673
Published online Jun 8, 2016. doi: 10.4254/wjh.v8.i16.673
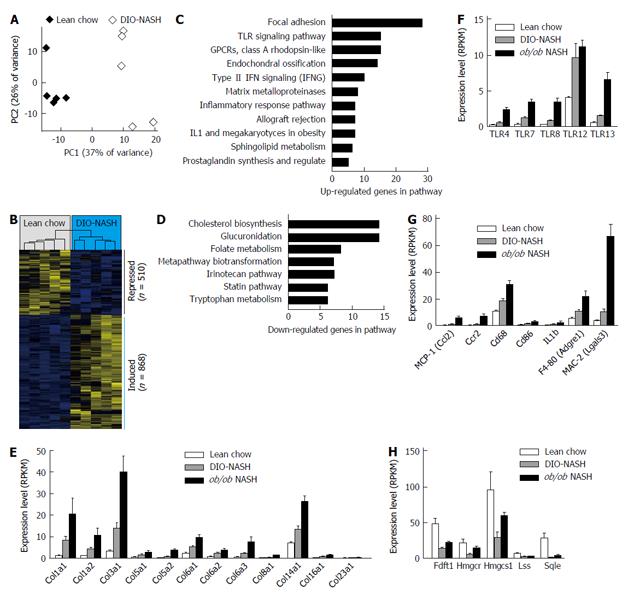
Figure 2 Gene expression analysis by RNAsequencing and bioinformatics.
A: Principal component analysis of the 500 most variable genes, [principal component (PC)]; B: Hierarchical clustering of the differentially expressed genes, bars on the right indicate the induced and repressed genes; C: Pathways enriched for the induced (up-regulated) genes, filtered for P < 0.01 and n > 4; D: Same as (C) for the down-regulated genes; E-H: Expression levels of selected differentially expressed genes shown as mean ± SEM. Lean chow (n = 5), DIO-NASH (n = 5), ob/ob NASH (n = 5). NASH: Nonalcoholic steatohepatitis; BW: Body weight; TLR: Toll-like receptor; IFN: Interferon; IL1: Interleukine 1; MCP-1: Monocyte chemoattractant protein-1; GPCRs: G protein-coupled receptors; IFNG: Interferon gamma; RPKM: Reads per kilobase of transcript per million mapped reads; SEM: Standard error of the mean.
- Citation: Kristiansen MNB, Veidal SS, Rigbolt KTG, Tølbøl KS, Roth JD, Jelsing J, Vrang N, Feigh M. Obese diet-induced mouse models of nonalcoholic steatohepatitis-tracking disease by liver biopsy. World J Hepatol 2016; 8(16): 673-684
- URL: https://www.wjgnet.com/1948-5182/full/v8/i16/673.htm
- DOI: https://dx.doi.org/10.4254/wjh.v8.i16.673


