Copyright
©The Author(s) 2016.
World J Hepatol. May 18, 2016; 8(14): 616-624
Published online May 18, 2016. doi: 10.4254/wjh.v8.i14.616
Published online May 18, 2016. doi: 10.4254/wjh.v8.i14.616
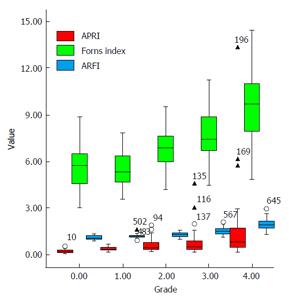
Figure 1 Box plots show correlation between noninvasive tests and histological stages from liver biopsy.
Top and bottom of boxes represent first and third quartiles, respectively. Length of box represents interquartile range within which 50% of values are located. Line through each box represents median. Error bars mark the minimum and maximum values (range). Small circles represent the outliers. Triangles represent the extreme value, which is > 3 × interquartile range. ARFI: Acoustic radiation force impulse; APRI: Aspartate transaminase to platelet ratio index.
- Citation: Dong CF, Xiao J, Shan LB, Li HY, Xiong YJ, Yang GL, Liu J, Yao SM, Li SX, Le XH, Yuan J, Zhou BP, Tipoe GL, Liu YX. Combined acoustic radiation force impulse, aminotransferase to platelet ratio index and Forns index assessment for hepatic fibrosis grading in hepatitis B. World J Hepatol 2016; 8(14): 616-624
- URL: https://www.wjgnet.com/1948-5182/full/v8/i14/616.htm
- DOI: https://dx.doi.org/10.4254/wjh.v8.i14.616


