Copyright
©The Author(s) 2016.
World J Hepatol. May 8, 2016; 8(13): 597-604
Published online May 8, 2016. doi: 10.4254/wjh.v8.i13.597
Published online May 8, 2016. doi: 10.4254/wjh.v8.i13.597
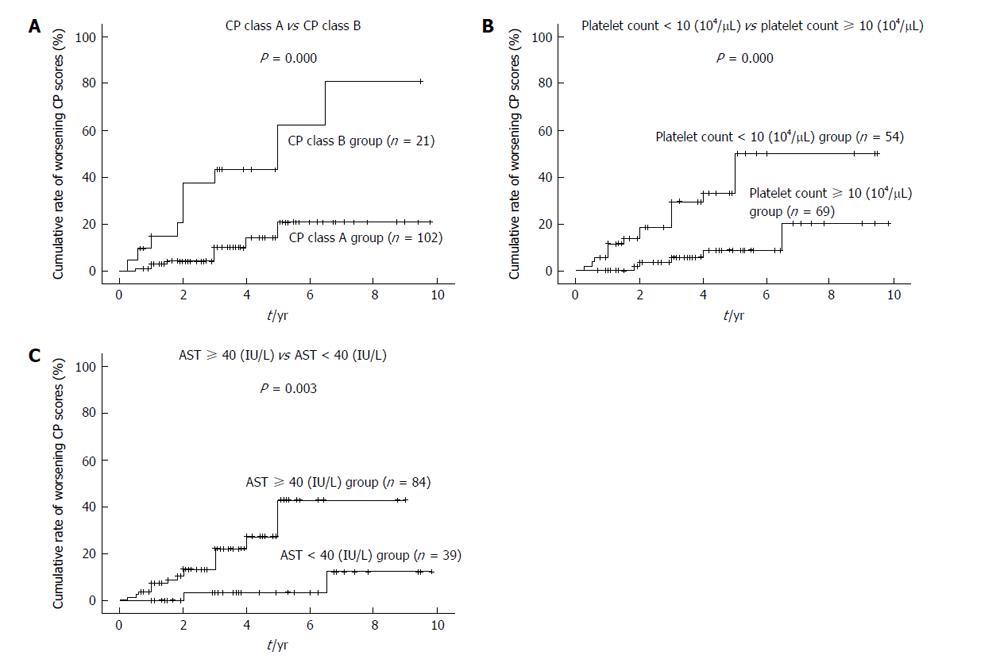
Figure 2 Comparison of cumulative rate of worsening Child-Pugh scores (defined as a 2-point increase) according to the Kaplan-Meier method.
P-values were calculated using a log-rank test. Analysis according to: A: CP class: A (n = 102) and B (n = 21); B: Platelet count: < 10 × 104/μL (n = 54) and ≥ 10 × 104/μL (n = 69); C: AST levels: < 40 IU/L (n = 39) and ≥ 40 IU/L (n = 84). CP: Child-Pugh; AST: Aspartate aminotransferase.
- Citation: Honda K, Seike M, Oribe J, Endo M, Arakawa M, Syo H, Iwao M, Tokoro M, Nishimura J, Mori T, Yamashita T, Fukuchi S, Muro T, Murakami K. Risk factors for deterioration of long-term liver function after radiofrequency ablation therapy. World J Hepatol 2016; 8(13): 597-604
- URL: https://www.wjgnet.com/1948-5182/full/v8/i13/597.htm
- DOI: https://dx.doi.org/10.4254/wjh.v8.i13.597


