Copyright
©The Author(s) 2015.
World J Hepatol. Apr 28, 2015; 7(6): 910-915
Published online Apr 28, 2015. doi: 10.4254/wjh.v7.i6.910
Published online Apr 28, 2015. doi: 10.4254/wjh.v7.i6.910
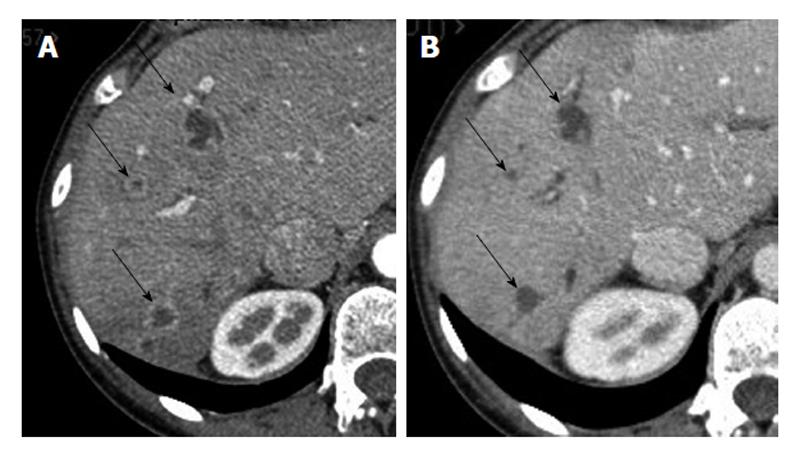
Figure 1 Computed tomography scans (A) prior to and (B) 4 mo after initiating sunitinib treatment, demonstrating density variation of three target lesions (arrows) in the liver.
Baseline computed tomography (CT) shows heterogeneous lesions with contrast-enhanced peripheral ring, while post-treatment CT shows disappearance of the hypervascular aspect of the three lesions.
- Citation: Dreyer C, Sablin MP, Bouattour M, Neuzillet C, Ronot M, Dokmak S, Belghiti J, Guedj N, Paradis V, Raymond E, Faivre S. Disease control with sunitinib in advanced intrahepatic cholangiocarcinoma resistant to gemcitabine-oxaliplatin chemotherapy. World J Hepatol 2015; 7(6): 910-915
- URL: https://www.wjgnet.com/1948-5182/full/v7/i6/910.htm
- DOI: https://dx.doi.org/10.4254/wjh.v7.i6.910


