Copyright
©The Author(s) 2015.
World J Hepatol. Aug 8, 2015; 7(16): 1987-2008
Published online Aug 8, 2015. doi: 10.4254/wjh.v7.i16.1987
Published online Aug 8, 2015. doi: 10.4254/wjh.v7.i16.1987
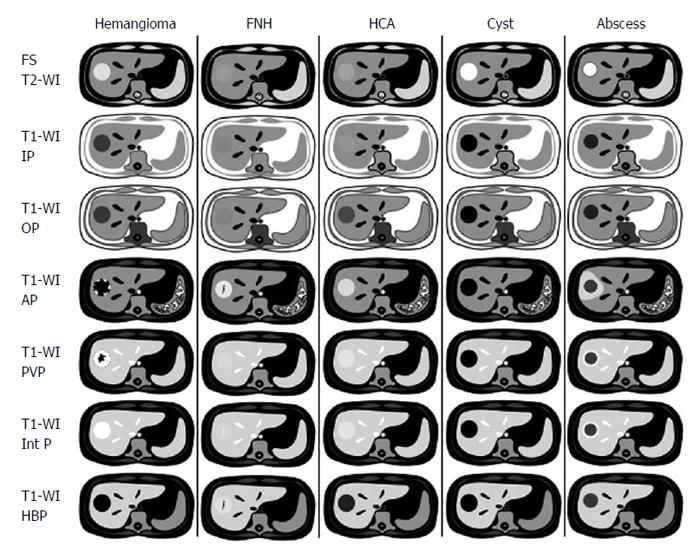
Figure 10 Stereotypical simplified schema, showing magnetic resonance imaging features of benign focal liver lesions.
FNH: Focal nodular hyperplasia; HCA: Hepatocellular adenoma; FS T2-WI: Fat-suppressed T2-weighted image; T1-WI IP: T1-weighted in-phase image; T1-WI OP: T1-weighted out-of-phase image; T1-WI AP: Post-contrast fat-suppressed T1-weighted image at the late arterial phase; T1-WI PVP: Post-contrast fat-suppressed T1-weighted image at the portal-venous phase; T1-WI Inter P: Post-contrast fat-suppressed T1-weighted image at the interstitial phase; T1-WI HBP: Post-contrast fat-suppressed T1-weighted image at the hepatobiliary phase (with hepatocyte-specific contrast agent).
- Citation: Matos AP, Velloni F, Ramalho M, AlObaidy M, Rajapaksha A, Semelka RC. Focal liver lesions: Practical magnetic resonance imaging approach. World J Hepatol 2015; 7(16): 1987-2008
- URL: https://www.wjgnet.com/1948-5182/full/v7/i16/1987.htm
- DOI: https://dx.doi.org/10.4254/wjh.v7.i16.1987


