Copyright
©The Author(s) 2015.
World J Hepatol. Aug 8, 2015; 7(16): 1987-2008
Published online Aug 8, 2015. doi: 10.4254/wjh.v7.i16.1987
Published online Aug 8, 2015. doi: 10.4254/wjh.v7.i16.1987
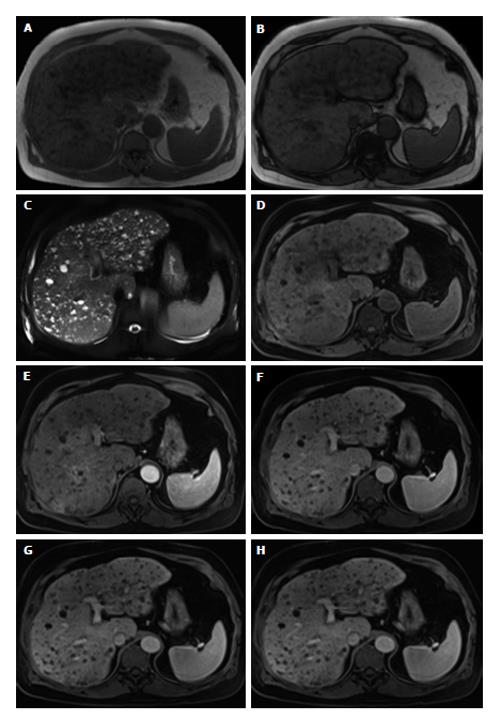
Figure 5 Multiple biliary hamartomas (also known as von Meyenburg complex).
In- (A) and opposed-phase (B) GRE T1-WI, fat-suppressed FSE T2-WI (C), pre (D) and postcontrast fat-suppressed 3D-GRE T1-WI at the arterial (E), portal venous (F) and interstitial (G) phases. There are multiple well-defined lesions scattered throughout the liver, smaller than 1.5 cm each. The lesions show low signal intensity on T1-WI (A, B and D), high signal intensity on T2-WI (C) and no enhancement after gadolinium administration (E-G). A thin peripheral enhancement is often present due to compressed liver parenchyma. GRE: Gradient-echo; FSE: Fast spinecho; T1-WI: T1-weighted images.
- Citation: Matos AP, Velloni F, Ramalho M, AlObaidy M, Rajapaksha A, Semelka RC. Focal liver lesions: Practical magnetic resonance imaging approach. World J Hepatol 2015; 7(16): 1987-2008
- URL: https://www.wjgnet.com/1948-5182/full/v7/i16/1987.htm
- DOI: https://dx.doi.org/10.4254/wjh.v7.i16.1987


