Copyright
©The Author(s) 2015.
World J Hepatol. Aug 8, 2015; 7(16): 1987-2008
Published online Aug 8, 2015. doi: 10.4254/wjh.v7.i16.1987
Published online Aug 8, 2015. doi: 10.4254/wjh.v7.i16.1987
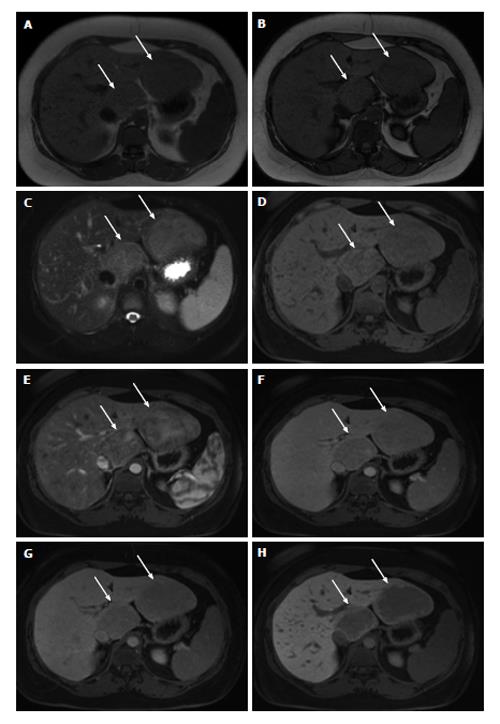
Figure 3 Hepatocellular adenomas.
In- (A) and opposed-phase (B) GRE T1-WI, fat-suppressed FSE T2-WI (C), pre (D) and post hepatocyte-specific contrast agent (Eovist®) fat-suppressed 3D-GRE T1-WI at the arterial (E), portal venous (F), interstitial (G) and hepatobiliary (H) phases. Two focal liver lesions are noted on the left and caudate lobes (arrows, A-G) of a noncirrhotic liver, showing slight drop of signal intensity on opposed-phase (B) comparing with the in-phase (A) T1-WI, which is related to minimally fat content. Note that the liver parenchyma also shows minimal steatosis. The lesions demonstrate mild high signal intensity on T2-WI (C), heterogeneous enhancement on the postcontrast arterial phase image (E) and subsequent washout on later postcontrast images (F and G). On the hepatobiliary phase, acquired 20 min after the hepatocyte-specific contrast agent, the lesions show no contrast uptake, excluding the diagnosis of FNHs. GRE: Gradient-echo; FSE: Fast spinecho; T1-WI: T1-weighted images; FNH: Focal nodular hyperplasias.
- Citation: Matos AP, Velloni F, Ramalho M, AlObaidy M, Rajapaksha A, Semelka RC. Focal liver lesions: Practical magnetic resonance imaging approach. World J Hepatol 2015; 7(16): 1987-2008
- URL: https://www.wjgnet.com/1948-5182/full/v7/i16/1987.htm
- DOI: https://dx.doi.org/10.4254/wjh.v7.i16.1987


