Copyright
©The Author(s) 2015.
World J Hepatol. Aug 8, 2015; 7(16): 1987-2008
Published online Aug 8, 2015. doi: 10.4254/wjh.v7.i16.1987
Published online Aug 8, 2015. doi: 10.4254/wjh.v7.i16.1987
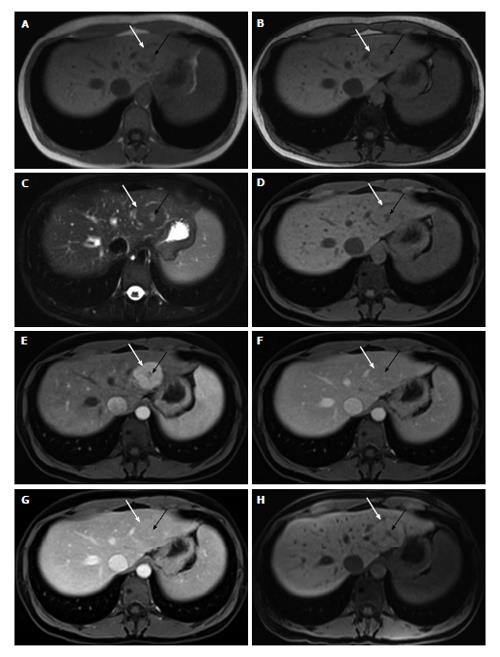
Figure 2 Focal nodular hyperplasia.
In- (A) and opposed-phase (B) GRE T1-WI, fat-suppressed FSE T2-WI (C), pre (D) and post hepatocyte-specific contrast agent (Eovist®) fat-suppressed 3D-GRE T1-WI at the arterial (E), portal venous (F), interstitial (G) and hepatobiliary (H) phases. There is a lesion on the left hepatic lobe (white arrow, A-H), showing isointense signal comparing to the surrounding liver on non-contrast T1-WI (A, B and D) and on T2-WI (C). The lesion also shows a central scar (black arrow, A-H), which is hypointense on T1-WI (A, B and D) and hyperintense on T2-WI (C). The lesion demonstrates homogeneous enhancement on early post-contrast images (E), becoming isointense to the underlying liver parenchyma (F and G). The progressive enhancement of the central scar is depicted on the delayed post-contrast images (G). On the hepatobiliary phase, 20 min after the administration the hepatocyte-specific contrast agent, the lesion shows uptake of the contrast agent, becoming minimally hyperintense comparing to the surrounding liver parenchyma. Since the central scar has no hepatocytes, there is no uptake of the contrast agent, becoming hypointense comparing to the liver and to the rest of the lesion. GRE: Gradient-echo; FSE: Fast spinecho; T1-WI: T1-weighted images.
- Citation: Matos AP, Velloni F, Ramalho M, AlObaidy M, Rajapaksha A, Semelka RC. Focal liver lesions: Practical magnetic resonance imaging approach. World J Hepatol 2015; 7(16): 1987-2008
- URL: https://www.wjgnet.com/1948-5182/full/v7/i16/1987.htm
- DOI: https://dx.doi.org/10.4254/wjh.v7.i16.1987


