Copyright
©2014 Baishideng Publishing Group Inc.
World J Hepatol. Aug 27, 2014; 6(8): 613-620
Published online Aug 27, 2014. doi: 10.4254/wjh.v6.i8.613
Published online Aug 27, 2014. doi: 10.4254/wjh.v6.i8.613
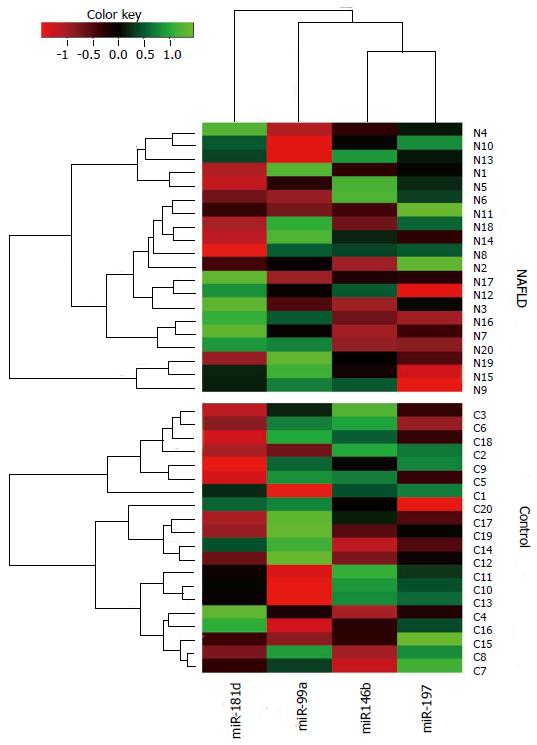
Figure 2 A cluster heatmap displaying the data values of samples and differentially expressed miRNAs simultaneously in a hierarchical cluster structure.
Bright red: Under-expression; black: No change; bright green: Over-expression.
- Citation: Celikbilek M, Baskol M, Taheri S, Deniz K, Dogan S, Zararsiz G, Gursoy S, Guven K, Ozbakır O, Dundar M, Yucesoy M. Circulating microRNAs in patients with non-alcoholic fatty liver disease. World J Hepatol 2014; 6(8): 613-620
- URL: https://www.wjgnet.com/1948-5182/full/v6/i8/613.htm
- DOI: https://dx.doi.org/10.4254/wjh.v6.i8.613


