Copyright
©2013 Baishideng Publishing Group Co.
World J Hepatol. Aug 27, 2013; 5(8): 439-444
Published online Aug 27, 2013. doi: 10.4254/wjh.v5.i8.439
Published online Aug 27, 2013. doi: 10.4254/wjh.v5.i8.439
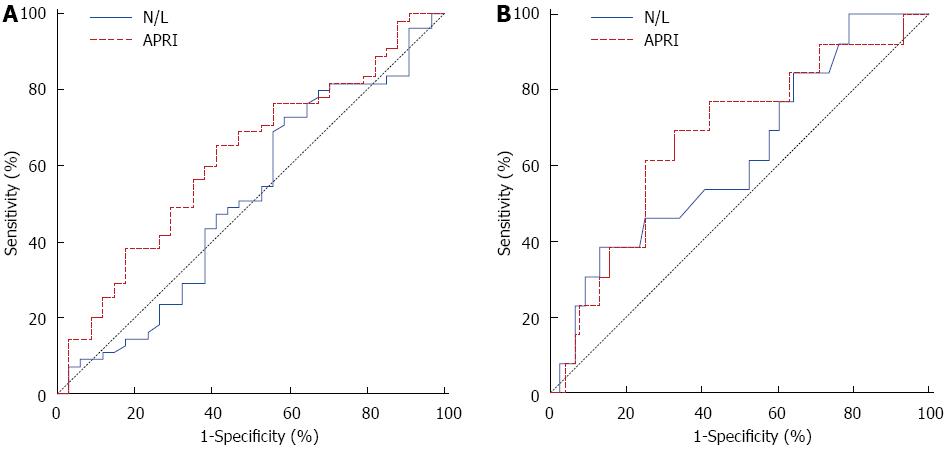
Figure 1 Comparison of receiver operating characteristic curves of neutrophil-lymphocyte ratio and aspartate aminotransferase/platelet ratio index values in identifying significant fibrosis (A) and cirrhosis (B).
For significant fibrosis area under receiver operating characteristic (ROC) curves were 0.51 (0.40-0.62) and 0.62 (0.51-0.72) respectively and the differences between two areas were not statistically significant. For cirrhosis, area under ROC curves were 0.62 (0.51-0.72) and 0.67 (0.57-0.77) respectively and the differences between two areas were not statistically significant. N/L: Neutrophil-lymphocyte ratio; APRI: Aspartate aminotransferase/platelet ratio index.
- Citation: Celikbilek M, Dogan S, Gursoy S, Zararsız G, Yurci A, Ozbakır O, Guven K, Yucesoy M. Noninvasive assessment of liver damage in chronic hepatitis B. World J Hepatol 2013; 5(8): 439-444
- URL: https://www.wjgnet.com/1948-5182/full/v5/i8/439.htm
- DOI: https://dx.doi.org/10.4254/wjh.v5.i8.439


