
















Copyright: ©Author(s) 2026.
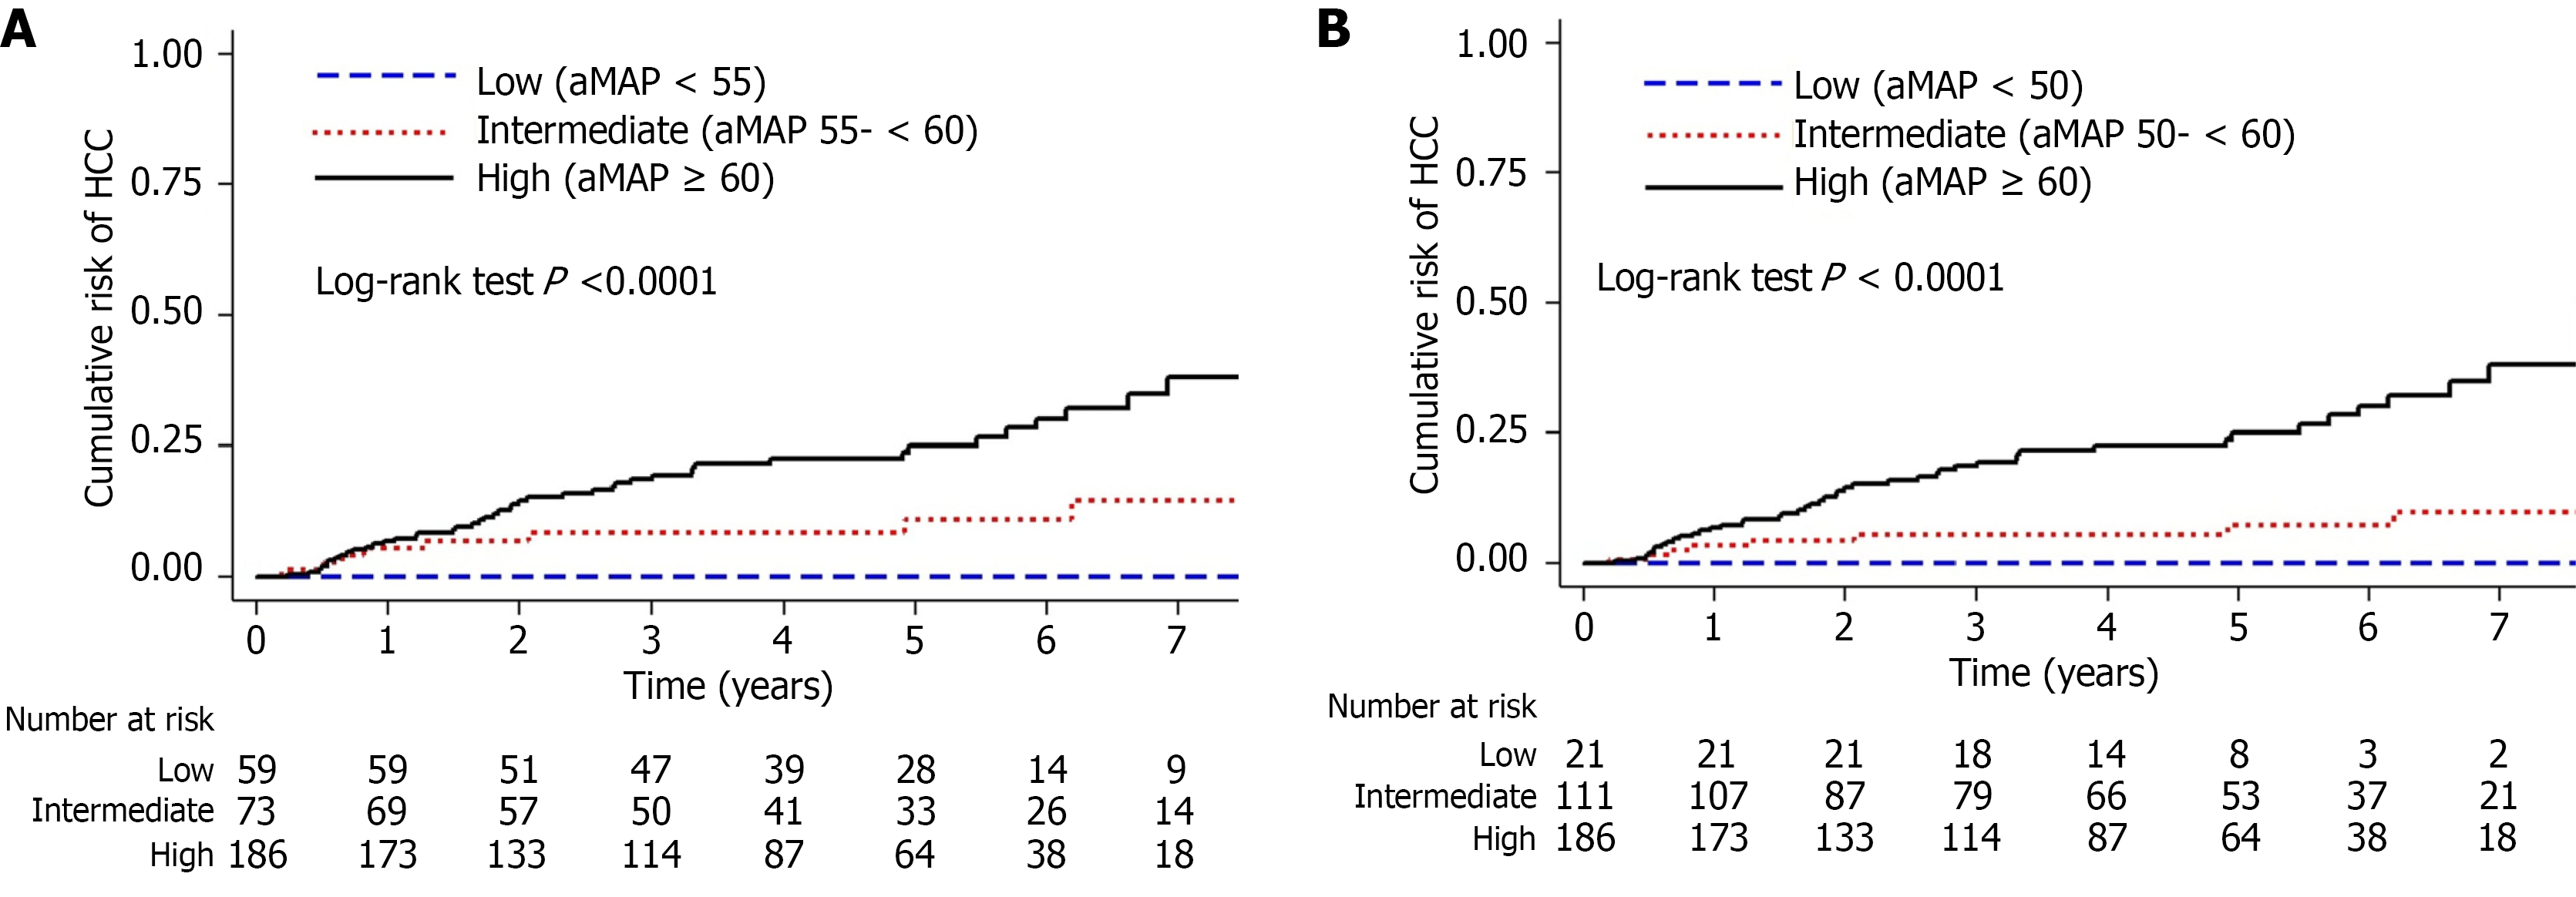
Figure 3 Kaplan-Meier curves.
A: Kaplan-Meier curves of hepatocellular carcinoma risk according to empirically derived age-male-albumin-bilirubin-platelet (aMAP) score strata. Patients were stratified into low-, intermediate-, and high-risk groups using thresholds of < 55, 55 to < 60, and ≥ 60, respectively; B: Kaplan-Meier curves of hepatocellular carcinoma risk according to the originally validated aMAP score strata. Patients were stratified into low-, intermediate-, and high-risk groups using thresholds of < 50, 50 to < 60, and ≥ 60, respectively. aMAP: Age-male-albumin-bilirubin-platelet score.
- Citation: Khongviwatsathien S, Tanwandee T. Age-male-albumin-bilirubin-platelet score stratifies hepatocellular carcinoma risk after sustained virological response in hepatitis C-related compensated advanced chronic liver disease. World J Hepatol 2026; 18(8): 124474
- URL: https://www.wjgnet.com/1948-5182/full/v18/i8/124474.htm
- DOI: https://dx.doi.org/10.4254/wjh.124474