
















Copyright: ©Author(s) 2026.
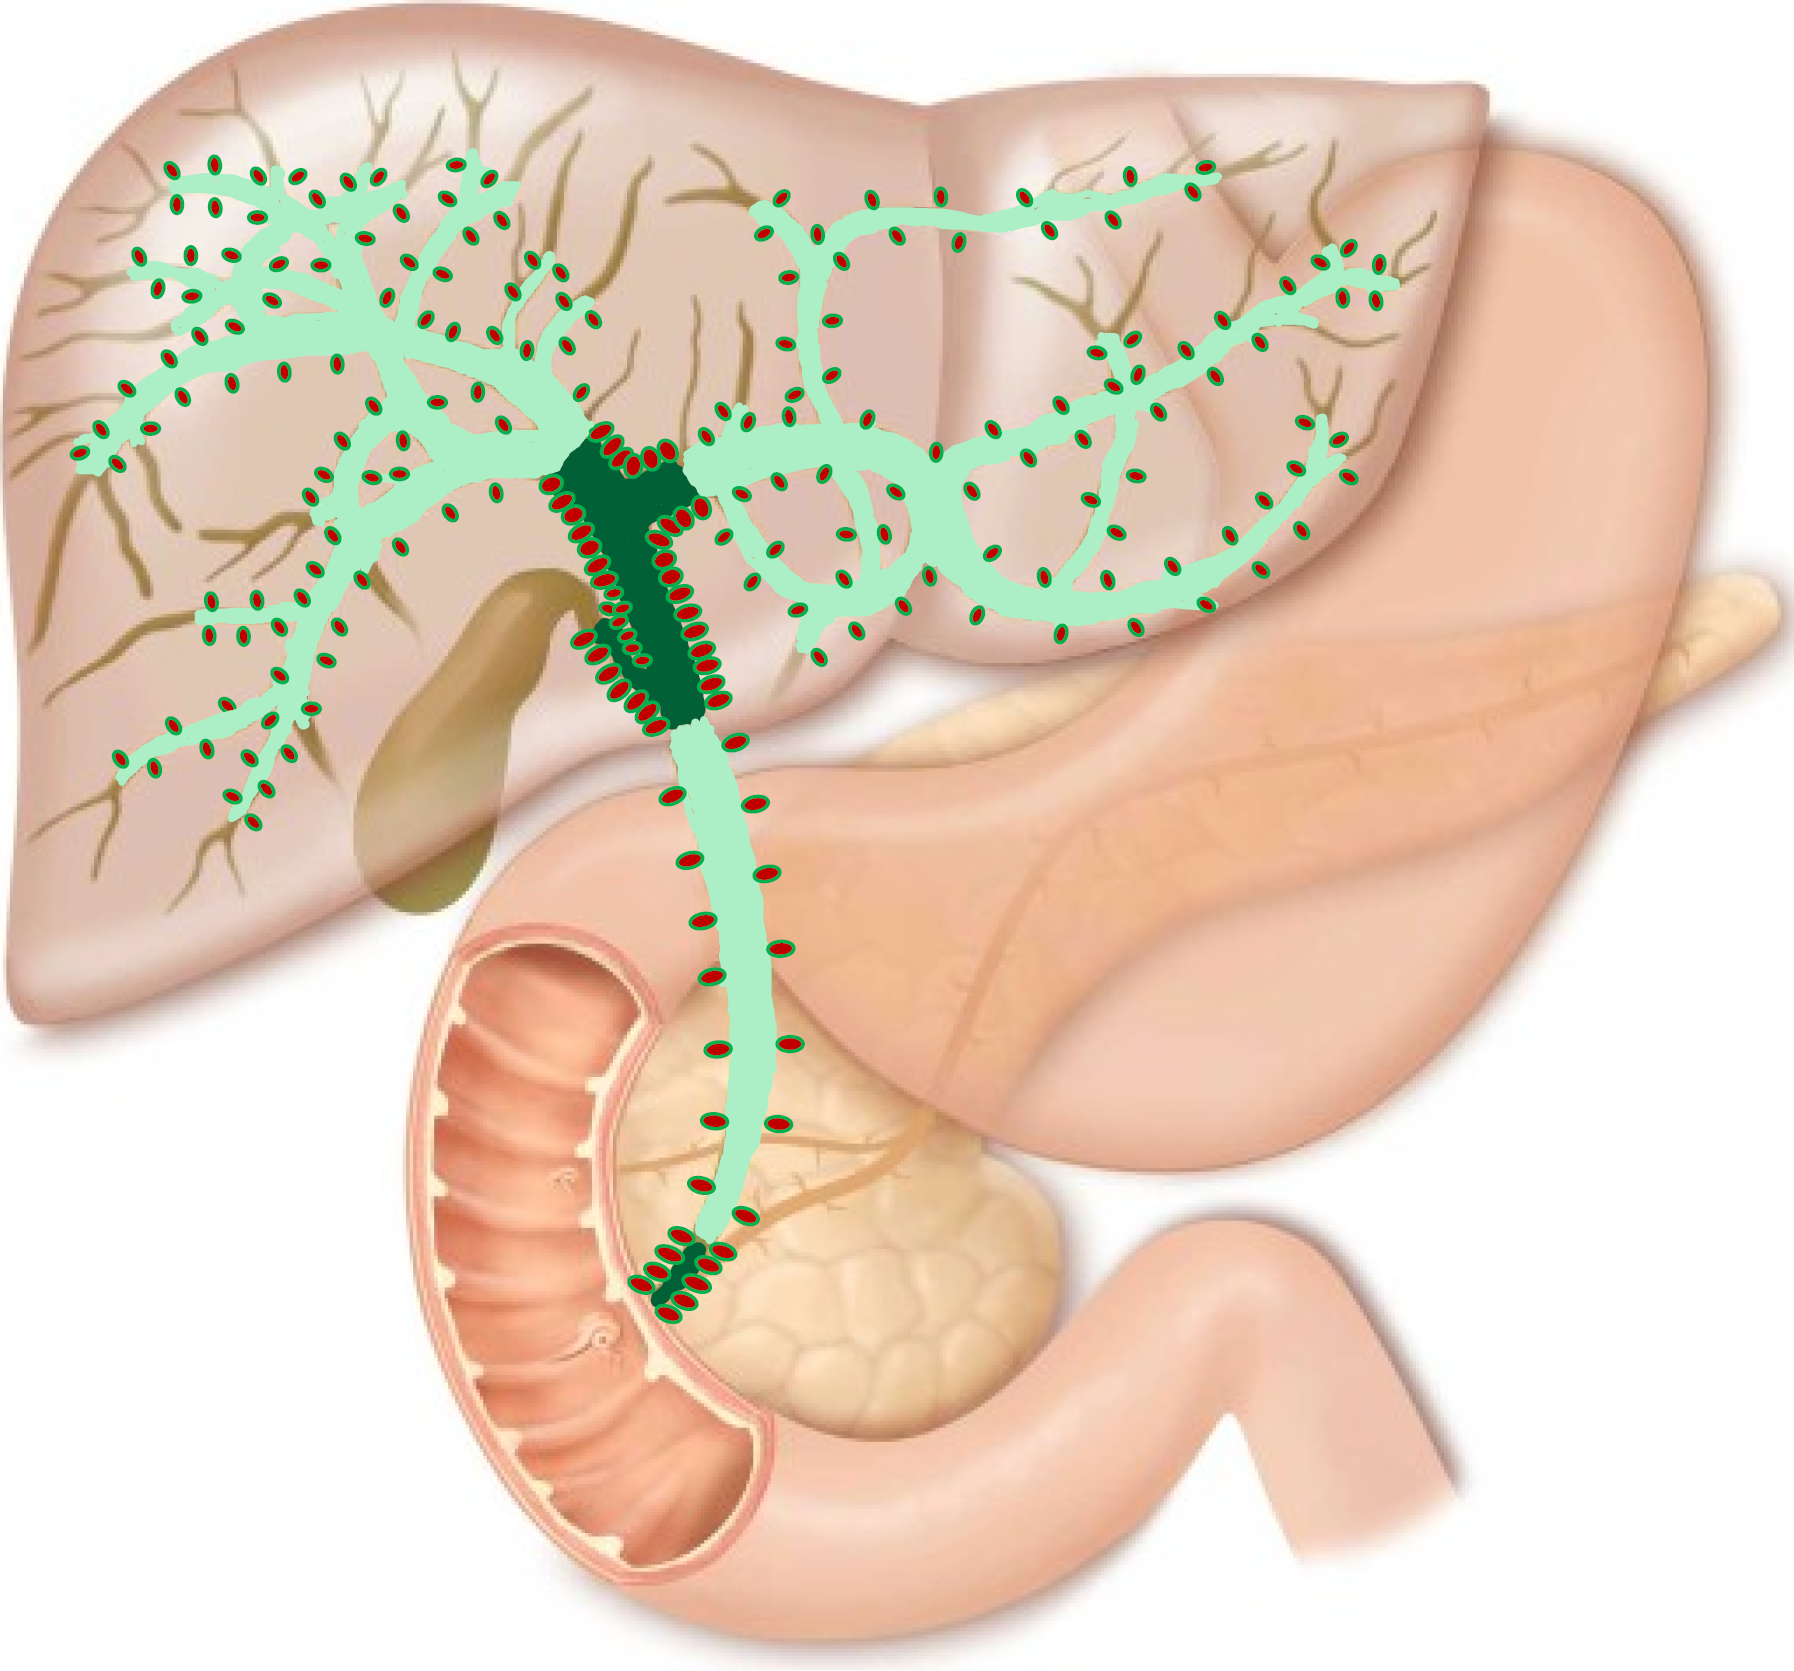
Figure 3 Density of peribiliary glands distribution in the biliary tree.
Dark green indicates high peribiliary glands (PBGs) density, light green indicates areas with fewer PBGs, and uncolored branches of the biliary tree indicate the absence of PBGs.
- Citation: Reshetnyak VI, Reshetnyak AA, Maev IV. Peribiliary and colonic crypt glands in primary sclerosing cholangitis and inflammatory bowel disease pathogenesis: New research perspectives. World J Hepatol 2026; 18(8): 123377
- URL: https://www.wjgnet.com/1948-5182/full/v18/i8/123377.htm
- DOI: https://dx.doi.org/10.4254/wjh.123377