
















Copyright: ©Author(s) 2026.
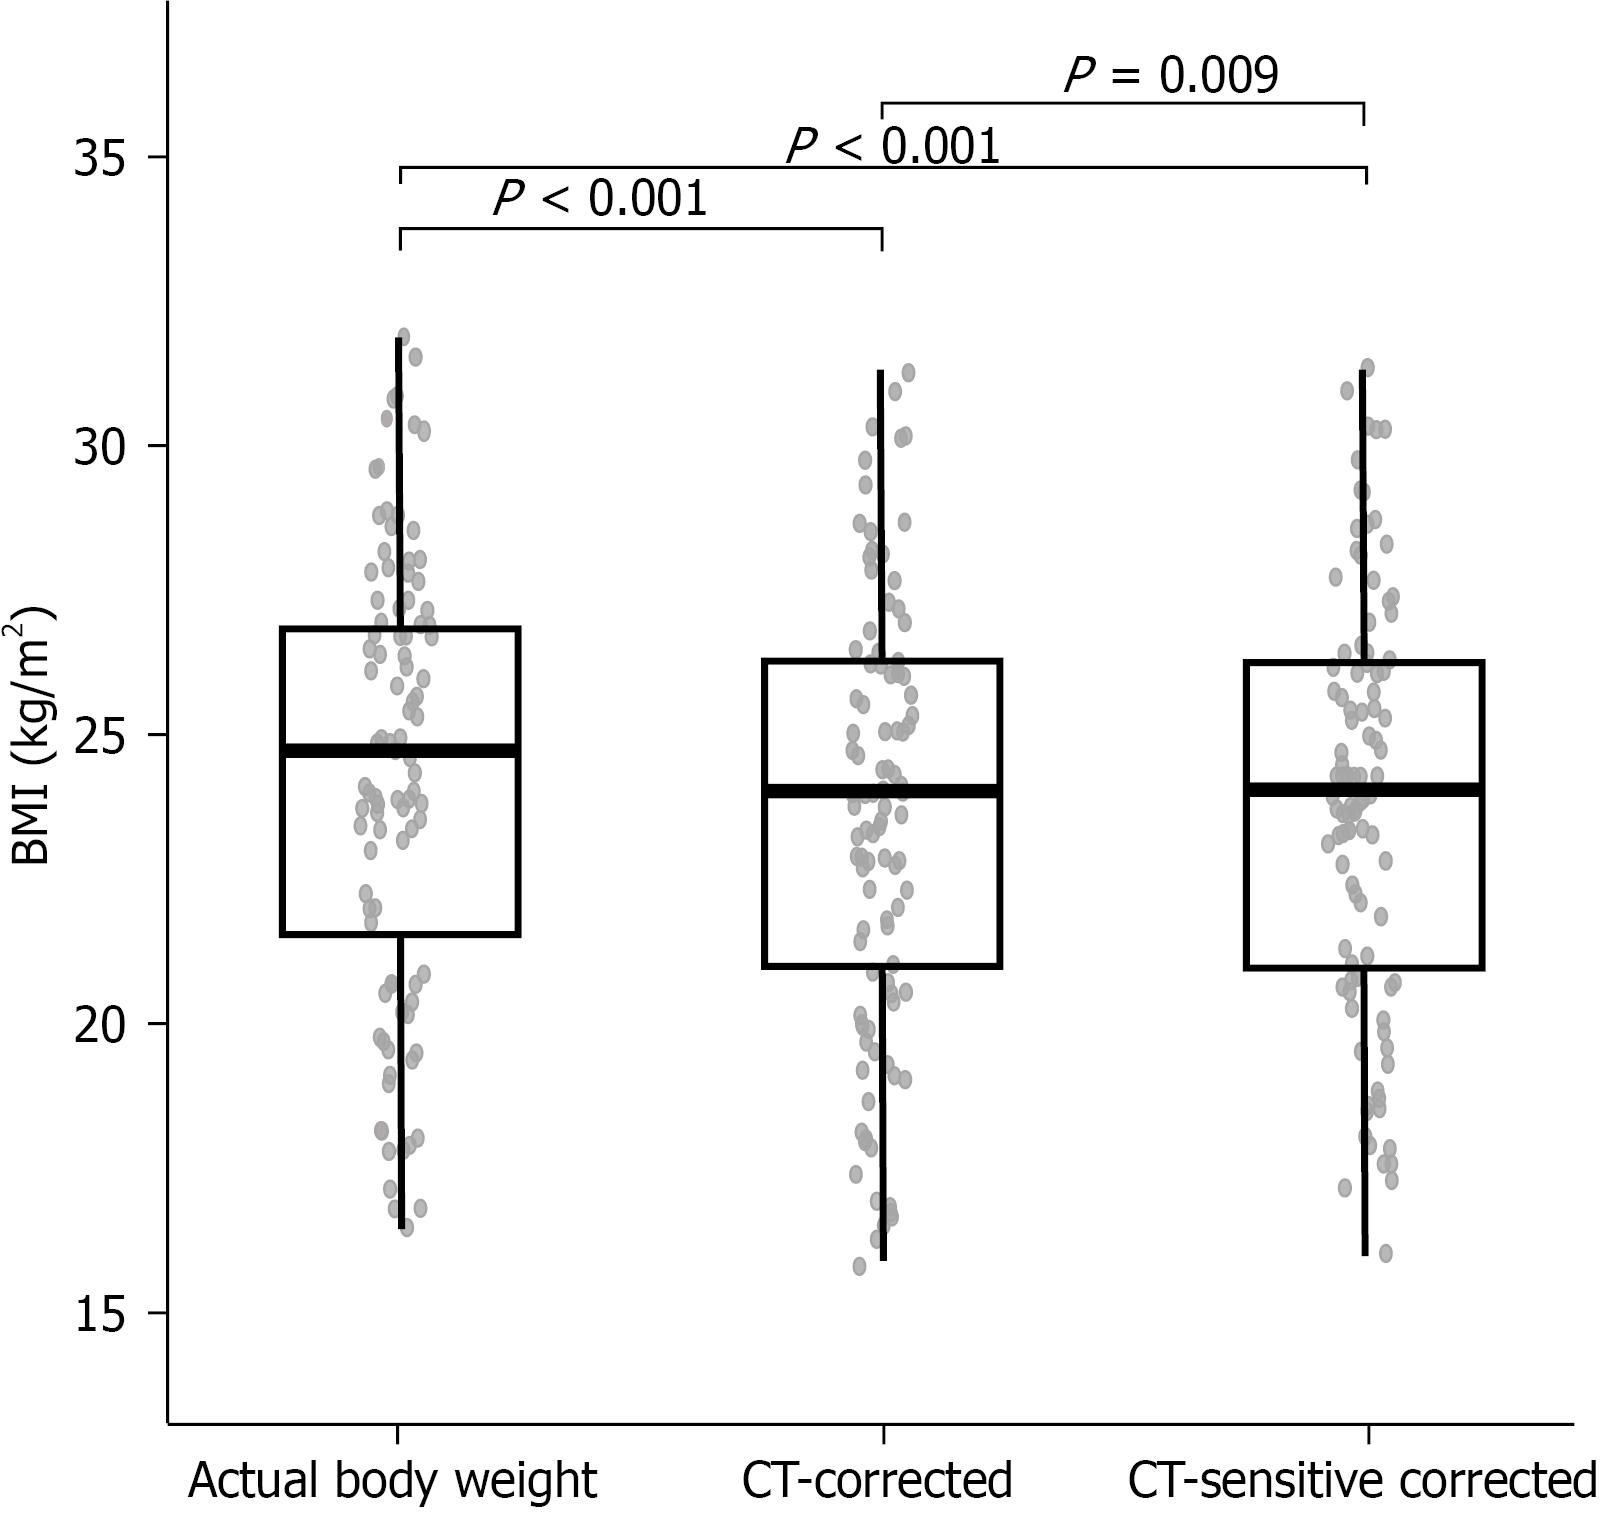
Figure 1 Distribution of the body mass index values obtained using the actual body weight method, computed tomography-corrected method, and computed tomography-sensitive corrected method in patients with cirrhosis and ascites.
The body mass index (BMI) values are presented as boxplots with individual data points. Paired comparisons were performed using the Wilcoxon signed-rank test. Both the computed tomography (CT)-corrected BMI and the CT-sensitive corrected BMI were significantly lower than the actual BMI (both P < 0.001), and the CT-sensitive corrected BMI was also lower than the CT-corrected BMI (P = 0.009). BMI: Body mass index; CT: Computed tomography.
- Citation: Zhao HJ, Su LH, Lu FH, Gao F, Sai JH, Li P, Shi JL, Wang L, Li SJ, Zhou F, Zhou LM, Wang N, He PY. Computed tomography-based correction of the body mass index improves malnutrition detection in patients with cirrhosis and ascites. World J Hepatol 2026; 18(7): 122692
- URL: https://www.wjgnet.com/1948-5182/full/v18/i7/122692.htm
- DOI: https://dx.doi.org/10.4254/wjh.122692