
















Copyright: ©Author(s) 2026.
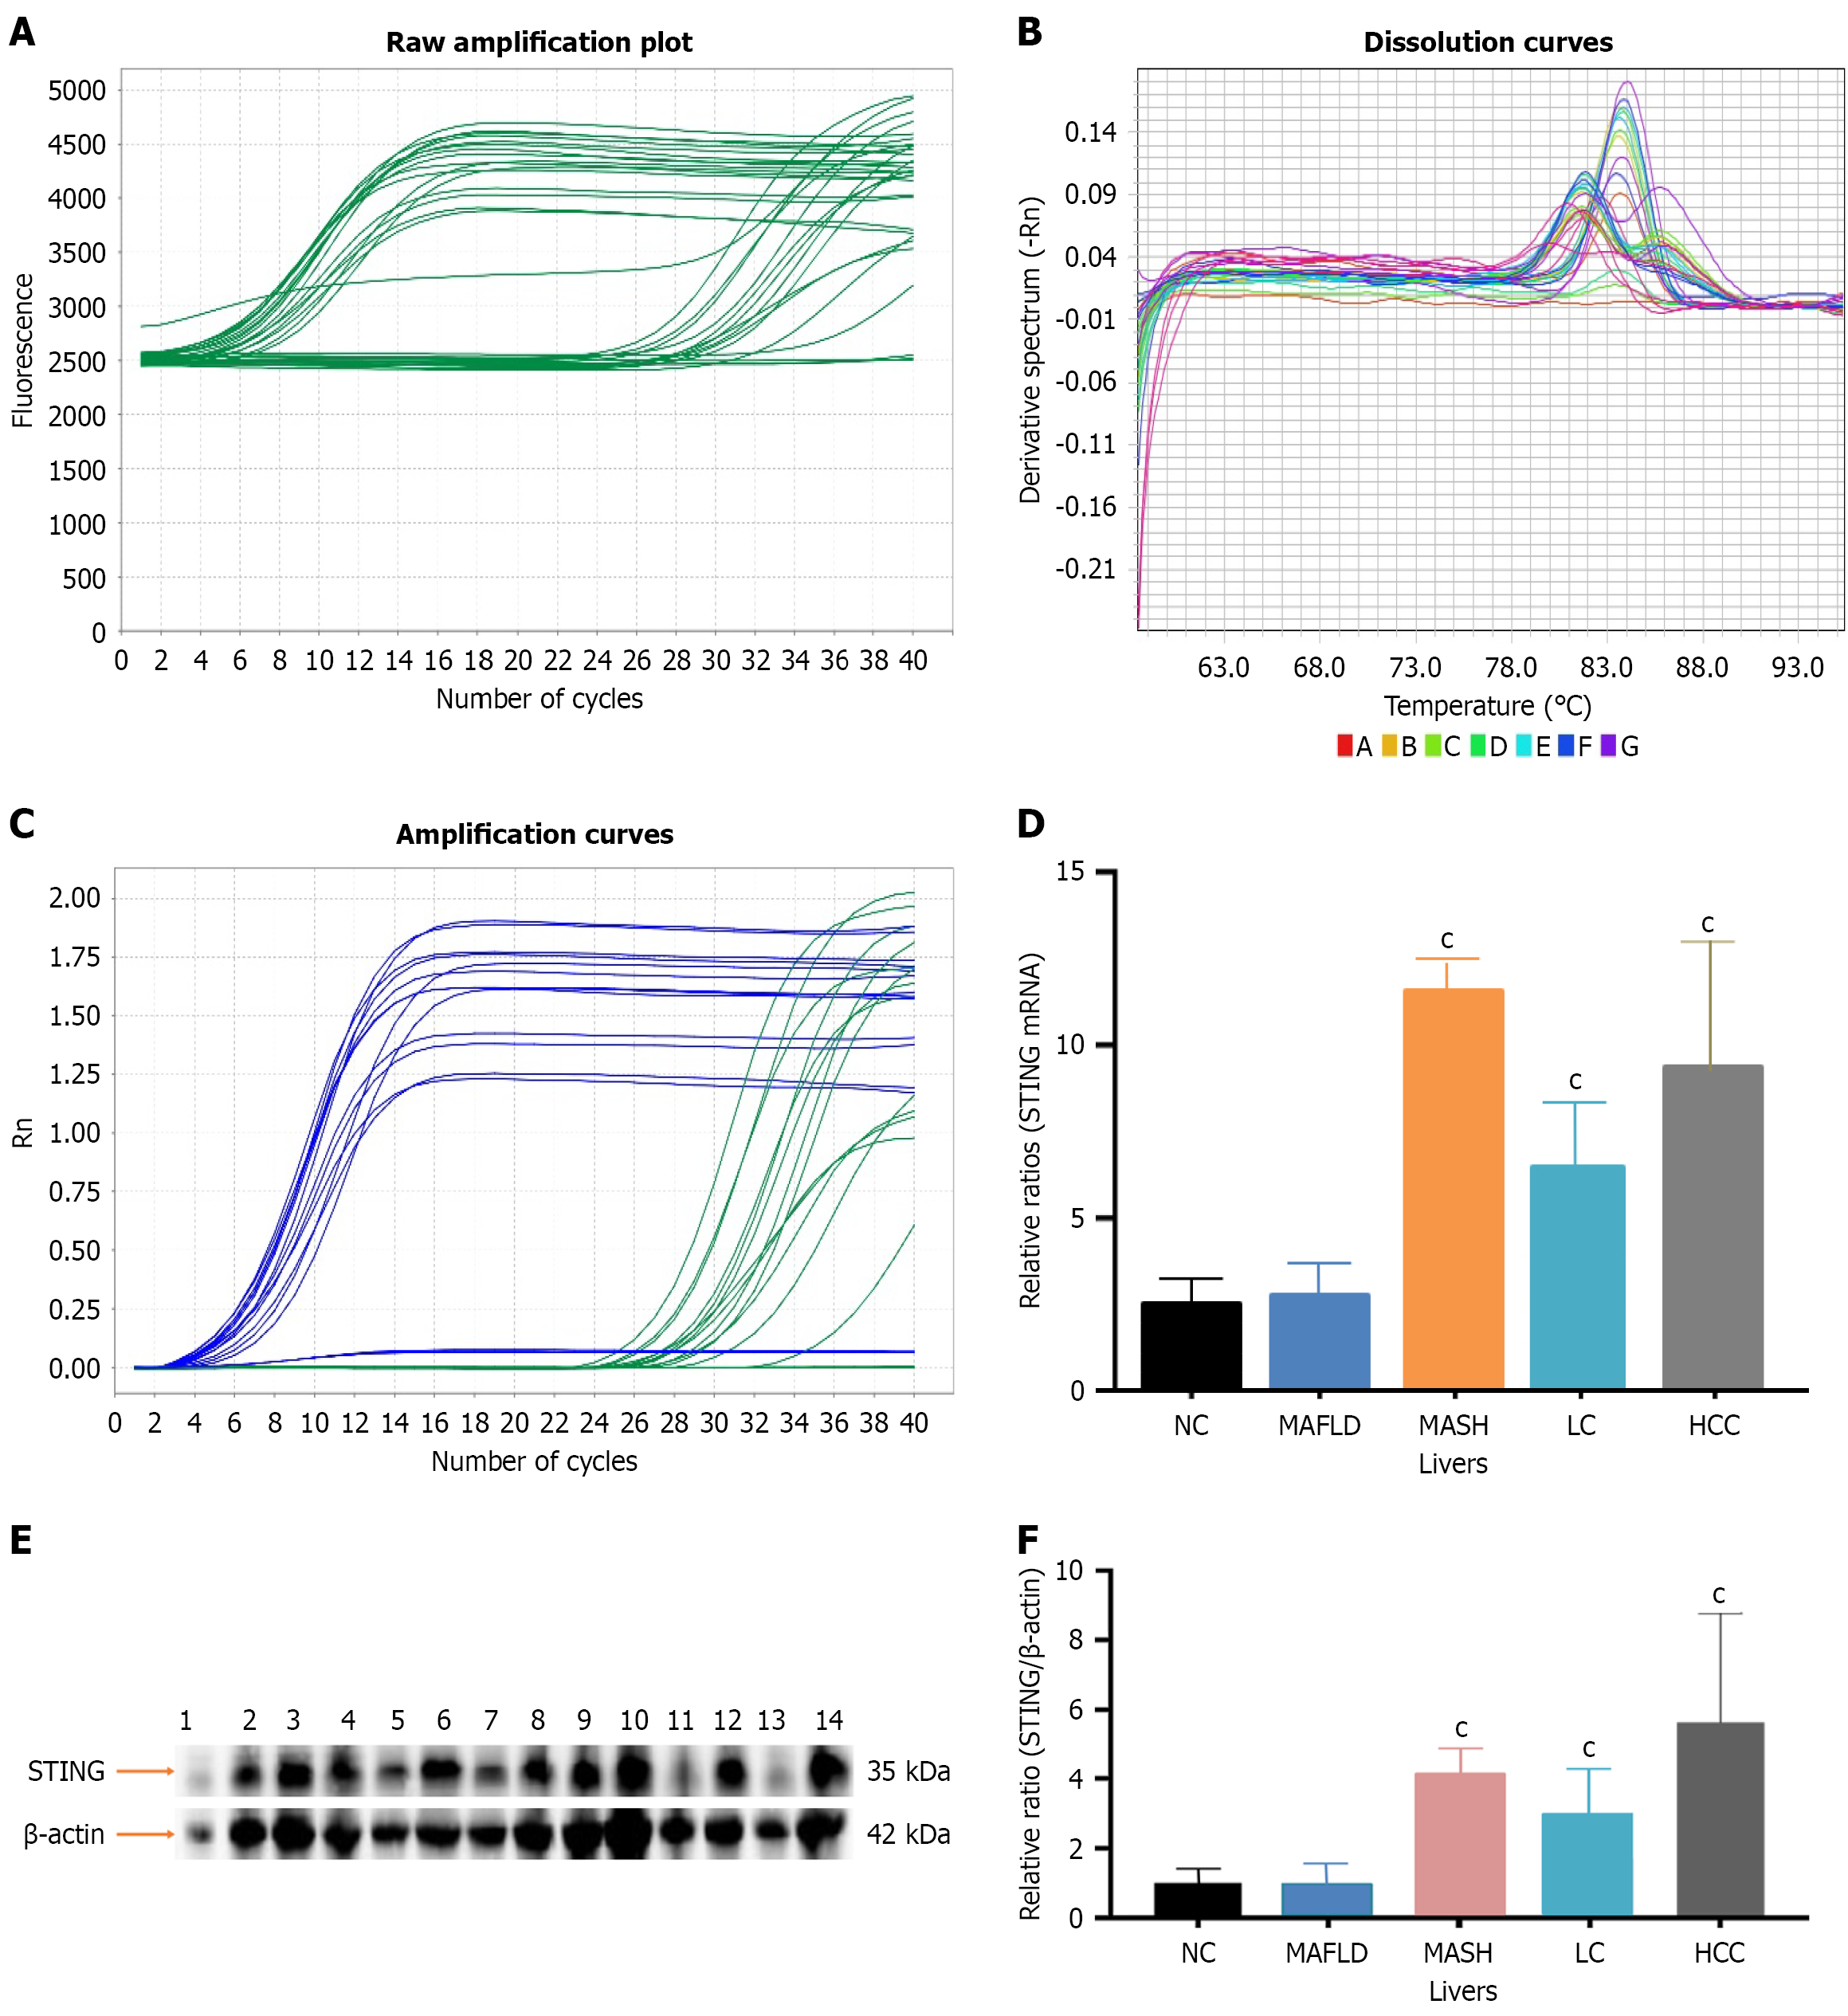
Figure 3 Dynamic changes in liver stimulator of interferon genes expressions at the mRNA or protein level.
A: Stimulator of interferon genes (STING) mRNA amplification plot by real time quantitative polymerase chain reaction; B: Melting curve of STING mRNA; C: Amplification curves of STING mRNA; D: Liver STING mRNA expressions among the different groups (n = 5/each); E: Liver STING immunoblot analysis in the normal control: 1, 11, and 13; metabolic dysfunction-associated fatty liver disease: 2, 5; metabolic dysfunction-associated steatohepatitis: 3, 4, 7; liver cirrhosis: 6, 8, 9; and hepatocellular carcinoma: 10, 12, 14 (n = 5/each) groups; F: Analysis of the relative ratios of liver STING to β-actin in the different groups. cP < 0.001 vs the control group. NC: Normal control; MAFLD: Metabolic dysfunction-associated fatty liver disease; MASH: Metabolic dysfunction-associated steatohepatitis; LC: Liver cirrhosis; HCC: Hepatocellular carcinoma; STING: Stimulator of interferon genes.
- Citation: Zhou MY, Fang RF, Tang H, Xia XX, Xie Q, Yao DF, Sai WL, Yao M. Activated cGAS-STING signaling promotes malignancy in metabolic dysfunction-associated fatty liver disease via mitochondrial DNA and immune cell dysfunction. World J Hepatol 2026; 18(7): 121423
- URL: https://www.wjgnet.com/1948-5182/full/v18/i7/121423.htm
- DOI: https://dx.doi.org/10.4254/wjh.121423