
















Copyright: ©Author(s) 2026.
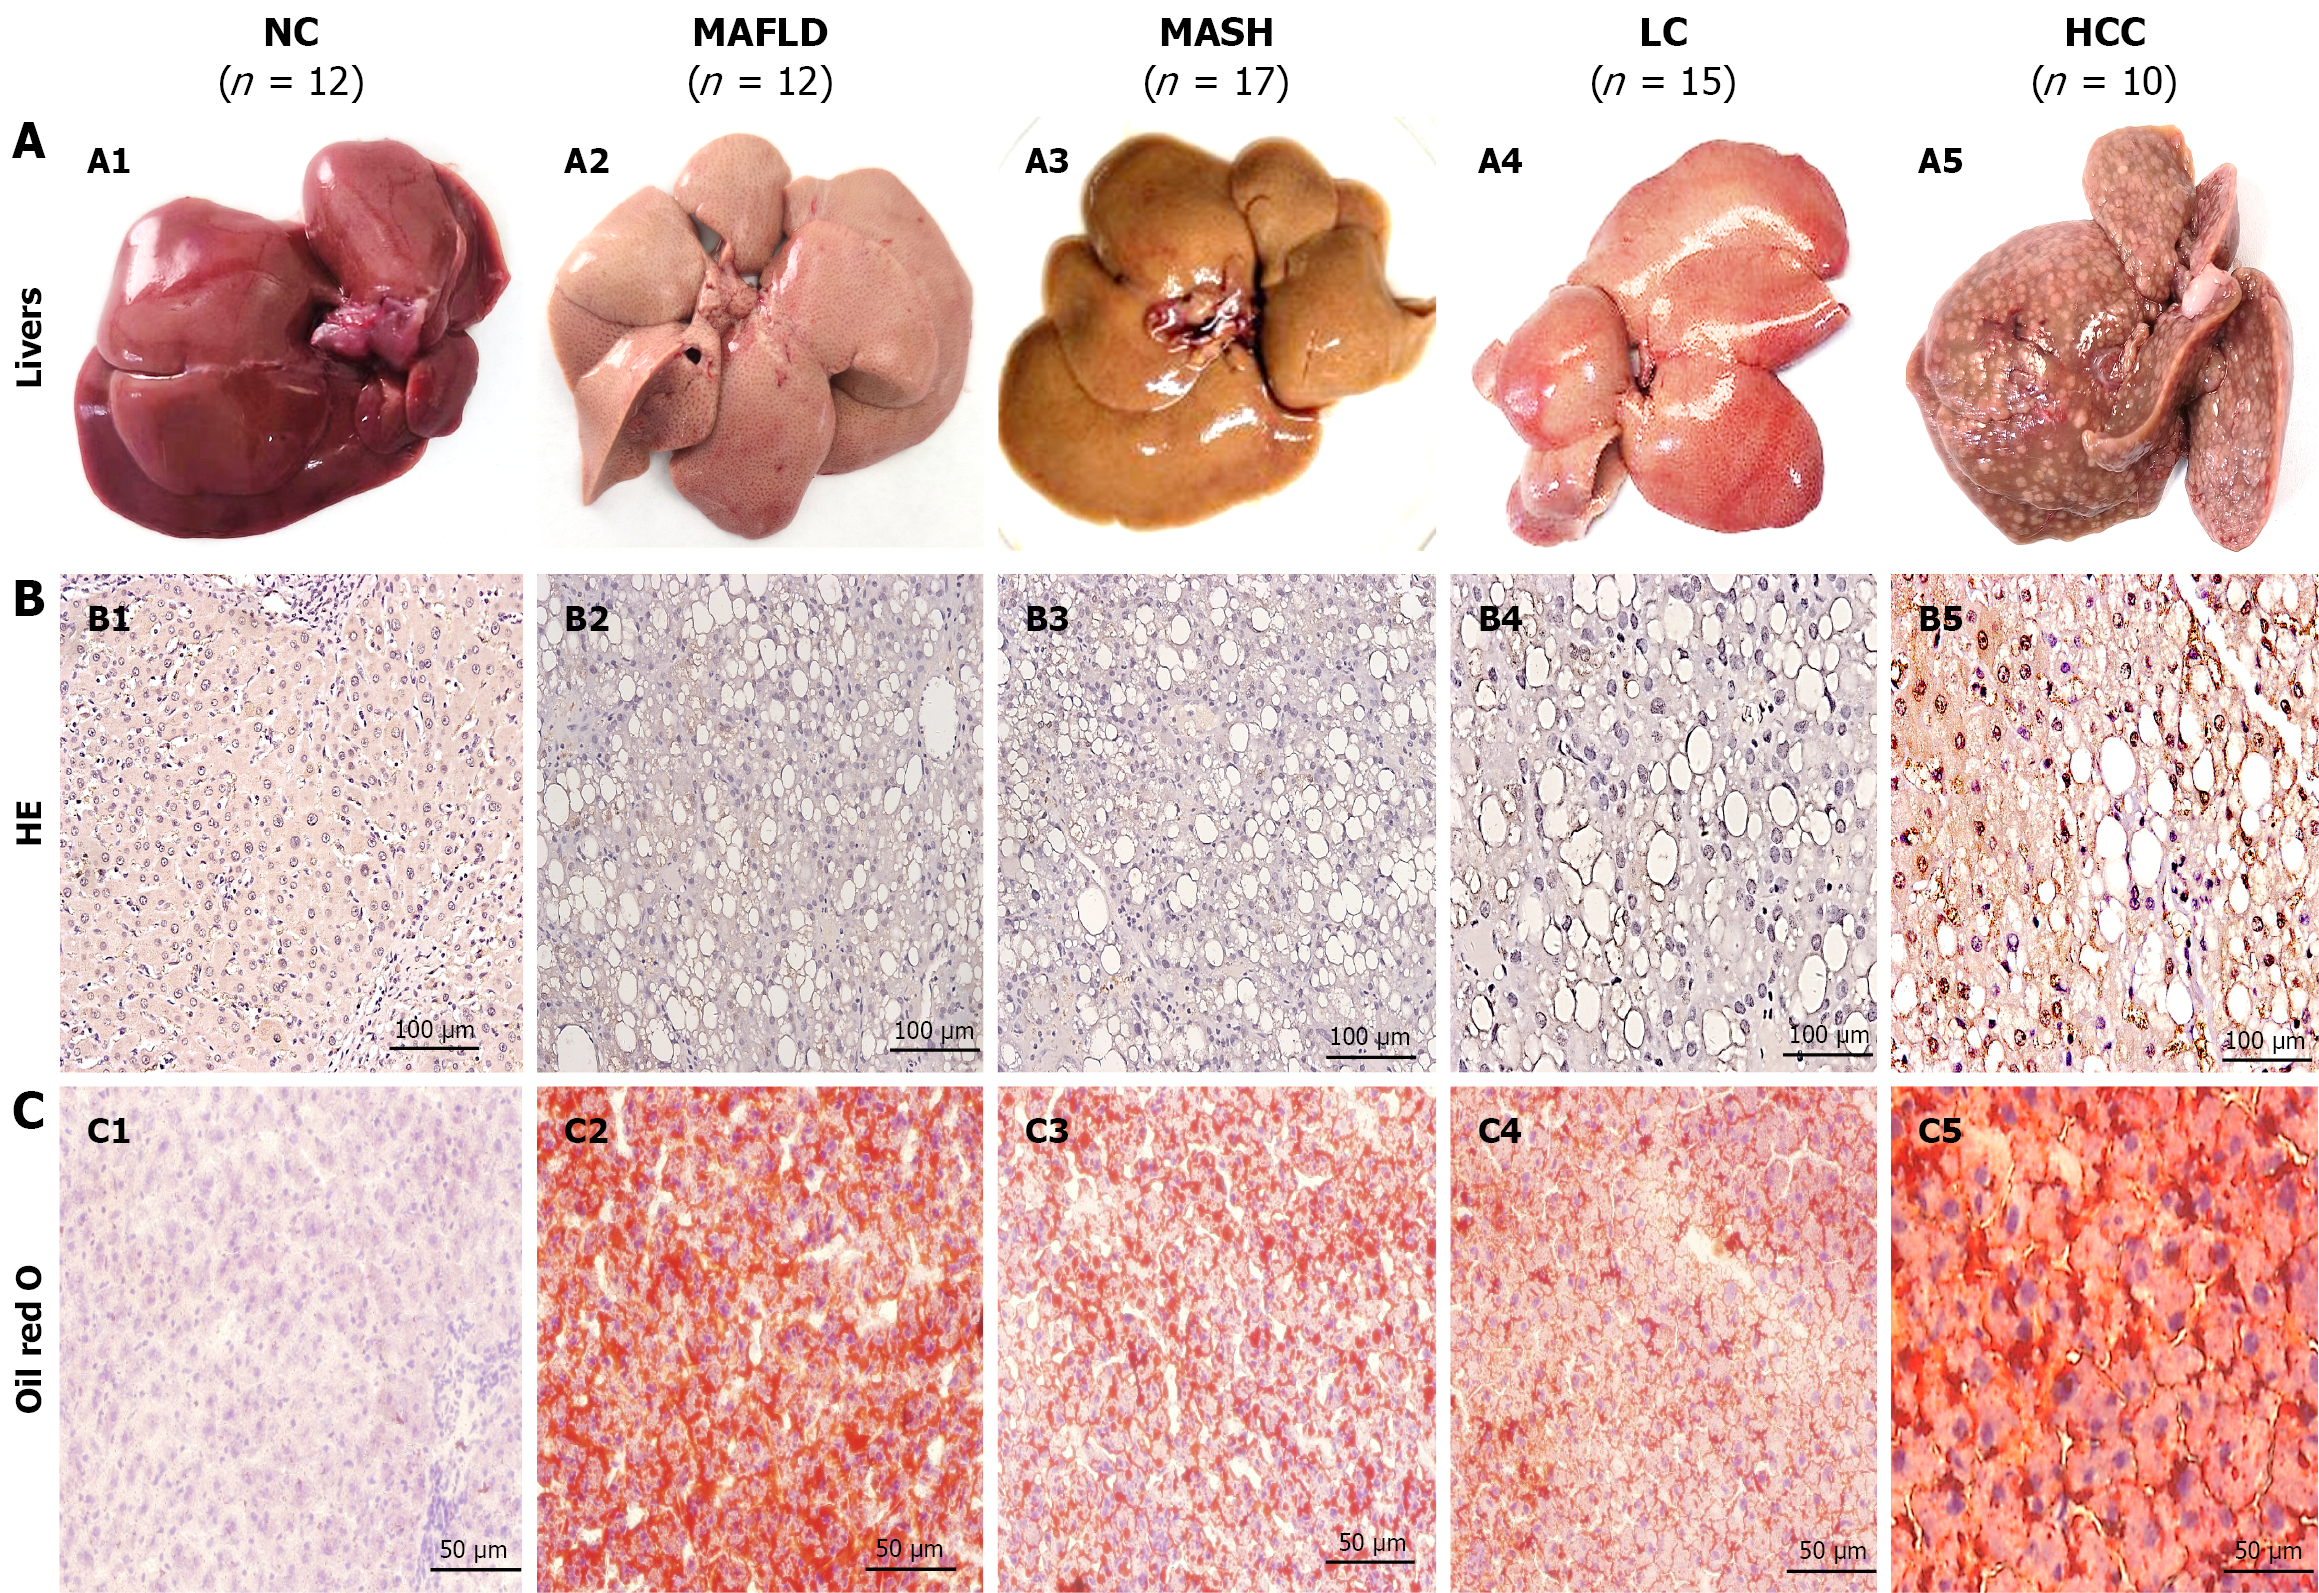
Figure 1 Rat liver histopathological grouping and lipid accumulations.
A: Livers from rats fed a normal diet (A1), a high-fat diet (HFD, A2), or a high-fat diet plus 2-fluorenyl acetamide at the early (A3), middle (A4) or last stage (A5); B: Histopathological groupings of the normal control (B1, n = 12), metabolic dysfunction-associated fatty liver disease (B2, n = 12), metabolic dysfunction-associated steatohepatitis (B3, n = 17), liver cirrhosis (B4, n = 15) and hepatocellular carcinoma (B5, n = 10) groups; C: Sections corresponding to the above livers were subjected to Oil Red O staining, and lipid accumulations in hepatocytes from metabolic dysfunction-associated steatohepatitis (C2), metabolic dysfunction-associated steatohepatitis (C3), liver cirrhosis (C4) and hepatocellular carcinoma (C5) rats but not from normal control rats (C1) were evaluated. NC: Normal control; MAFLD: Metabolic dysfunction-associated fatty liver disease; MASH: Metabolic dysfunction-associated steatohepatitis; LC: Liver cirrhosis; HCC: Hepatocellular carcinoma; HE: Hematoxylin and eosin.
- Citation: Zhou MY, Fang RF, Tang H, Xia XX, Xie Q, Yao DF, Sai WL, Yao M. Activated cGAS-STING signaling promotes malignancy in metabolic dysfunction-associated fatty liver disease via mitochondrial DNA and immune cell dysfunction. World J Hepatol 2026; 18(7): 121423
- URL: https://www.wjgnet.com/1948-5182/full/v18/i7/121423.htm
- DOI: https://dx.doi.org/10.4254/wjh.121423