
















Copyright: ©Author(s) 2026.
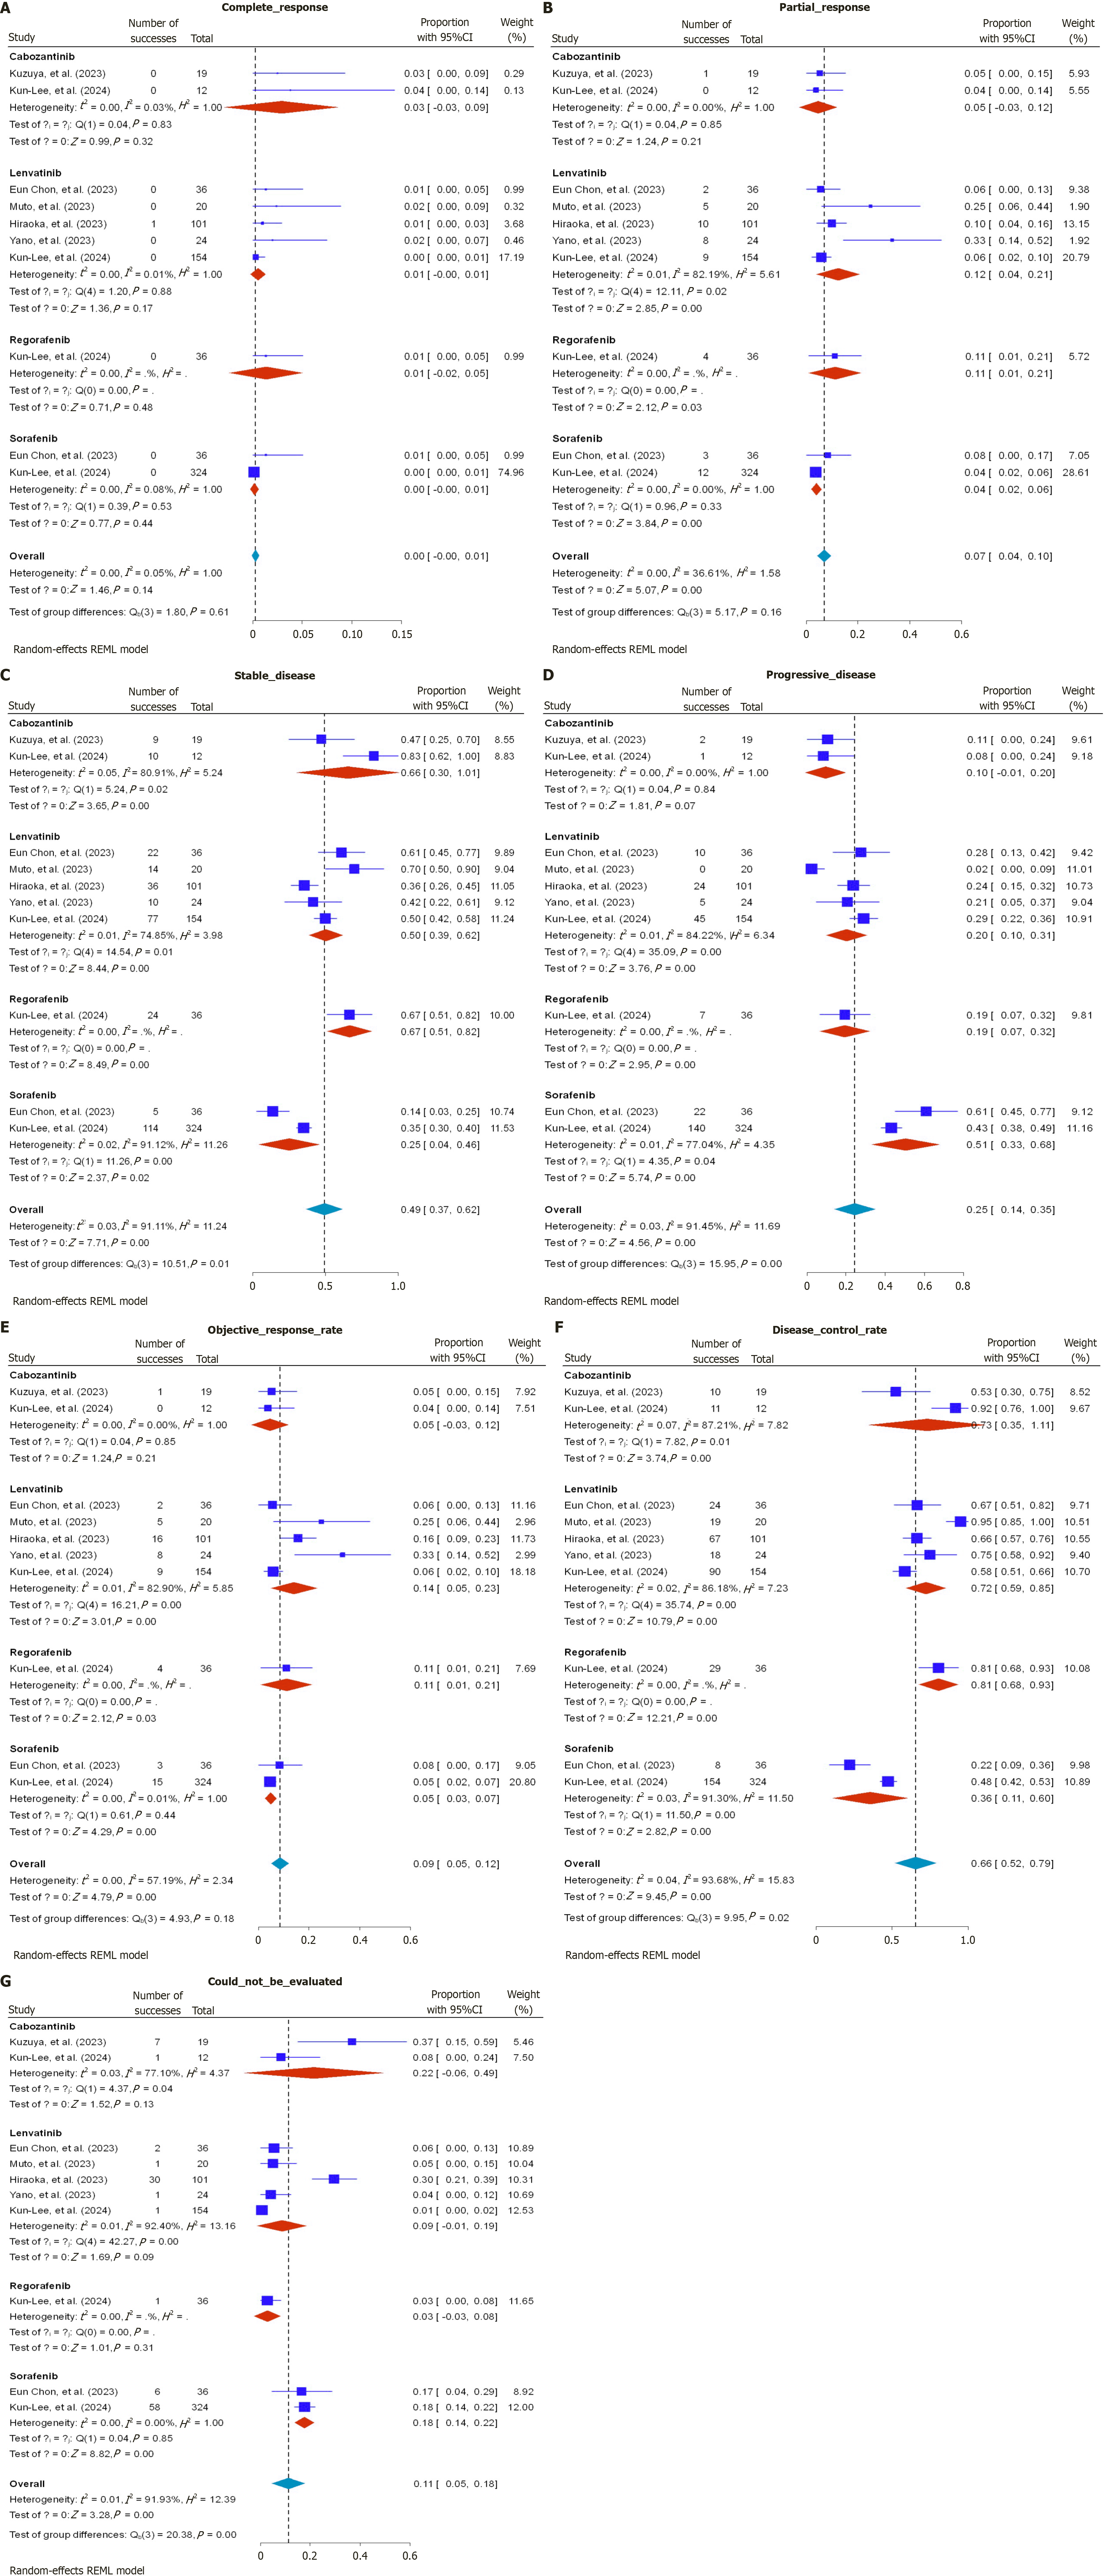
Figure 4 Forest plots of clinical response outcomes according to Response Evaluation Criteria in Solid Tumors version 1.
1. A: Complete response; B: Partial response; C: Stable disease; D: Progressive disease; E: Objective response rate; F: Disease control rate; G: Not evaluable. REML: Restricted maximum likelihood; CI: Confidence interval.
- Citation: Blanco Montecino R, Rodriguez NG, Coreas N, Mendoza-Quispe D, Kilani Y, Kamal SAF, Qureshi K, Richart JM. Tyrosine kinase inhibitors after progression on atezolizumab-bevacizumab in advanced hepatocellular carcinoma: A systematic review and meta-analysis. World J Hepatol 2026; 18(6): 121656
- URL: https://www.wjgnet.com/1948-5182/full/v18/i6/121656.htm
- DOI: https://dx.doi.org/10.4254/wjh.121656