
















Copyright: ©Author(s) 2026.
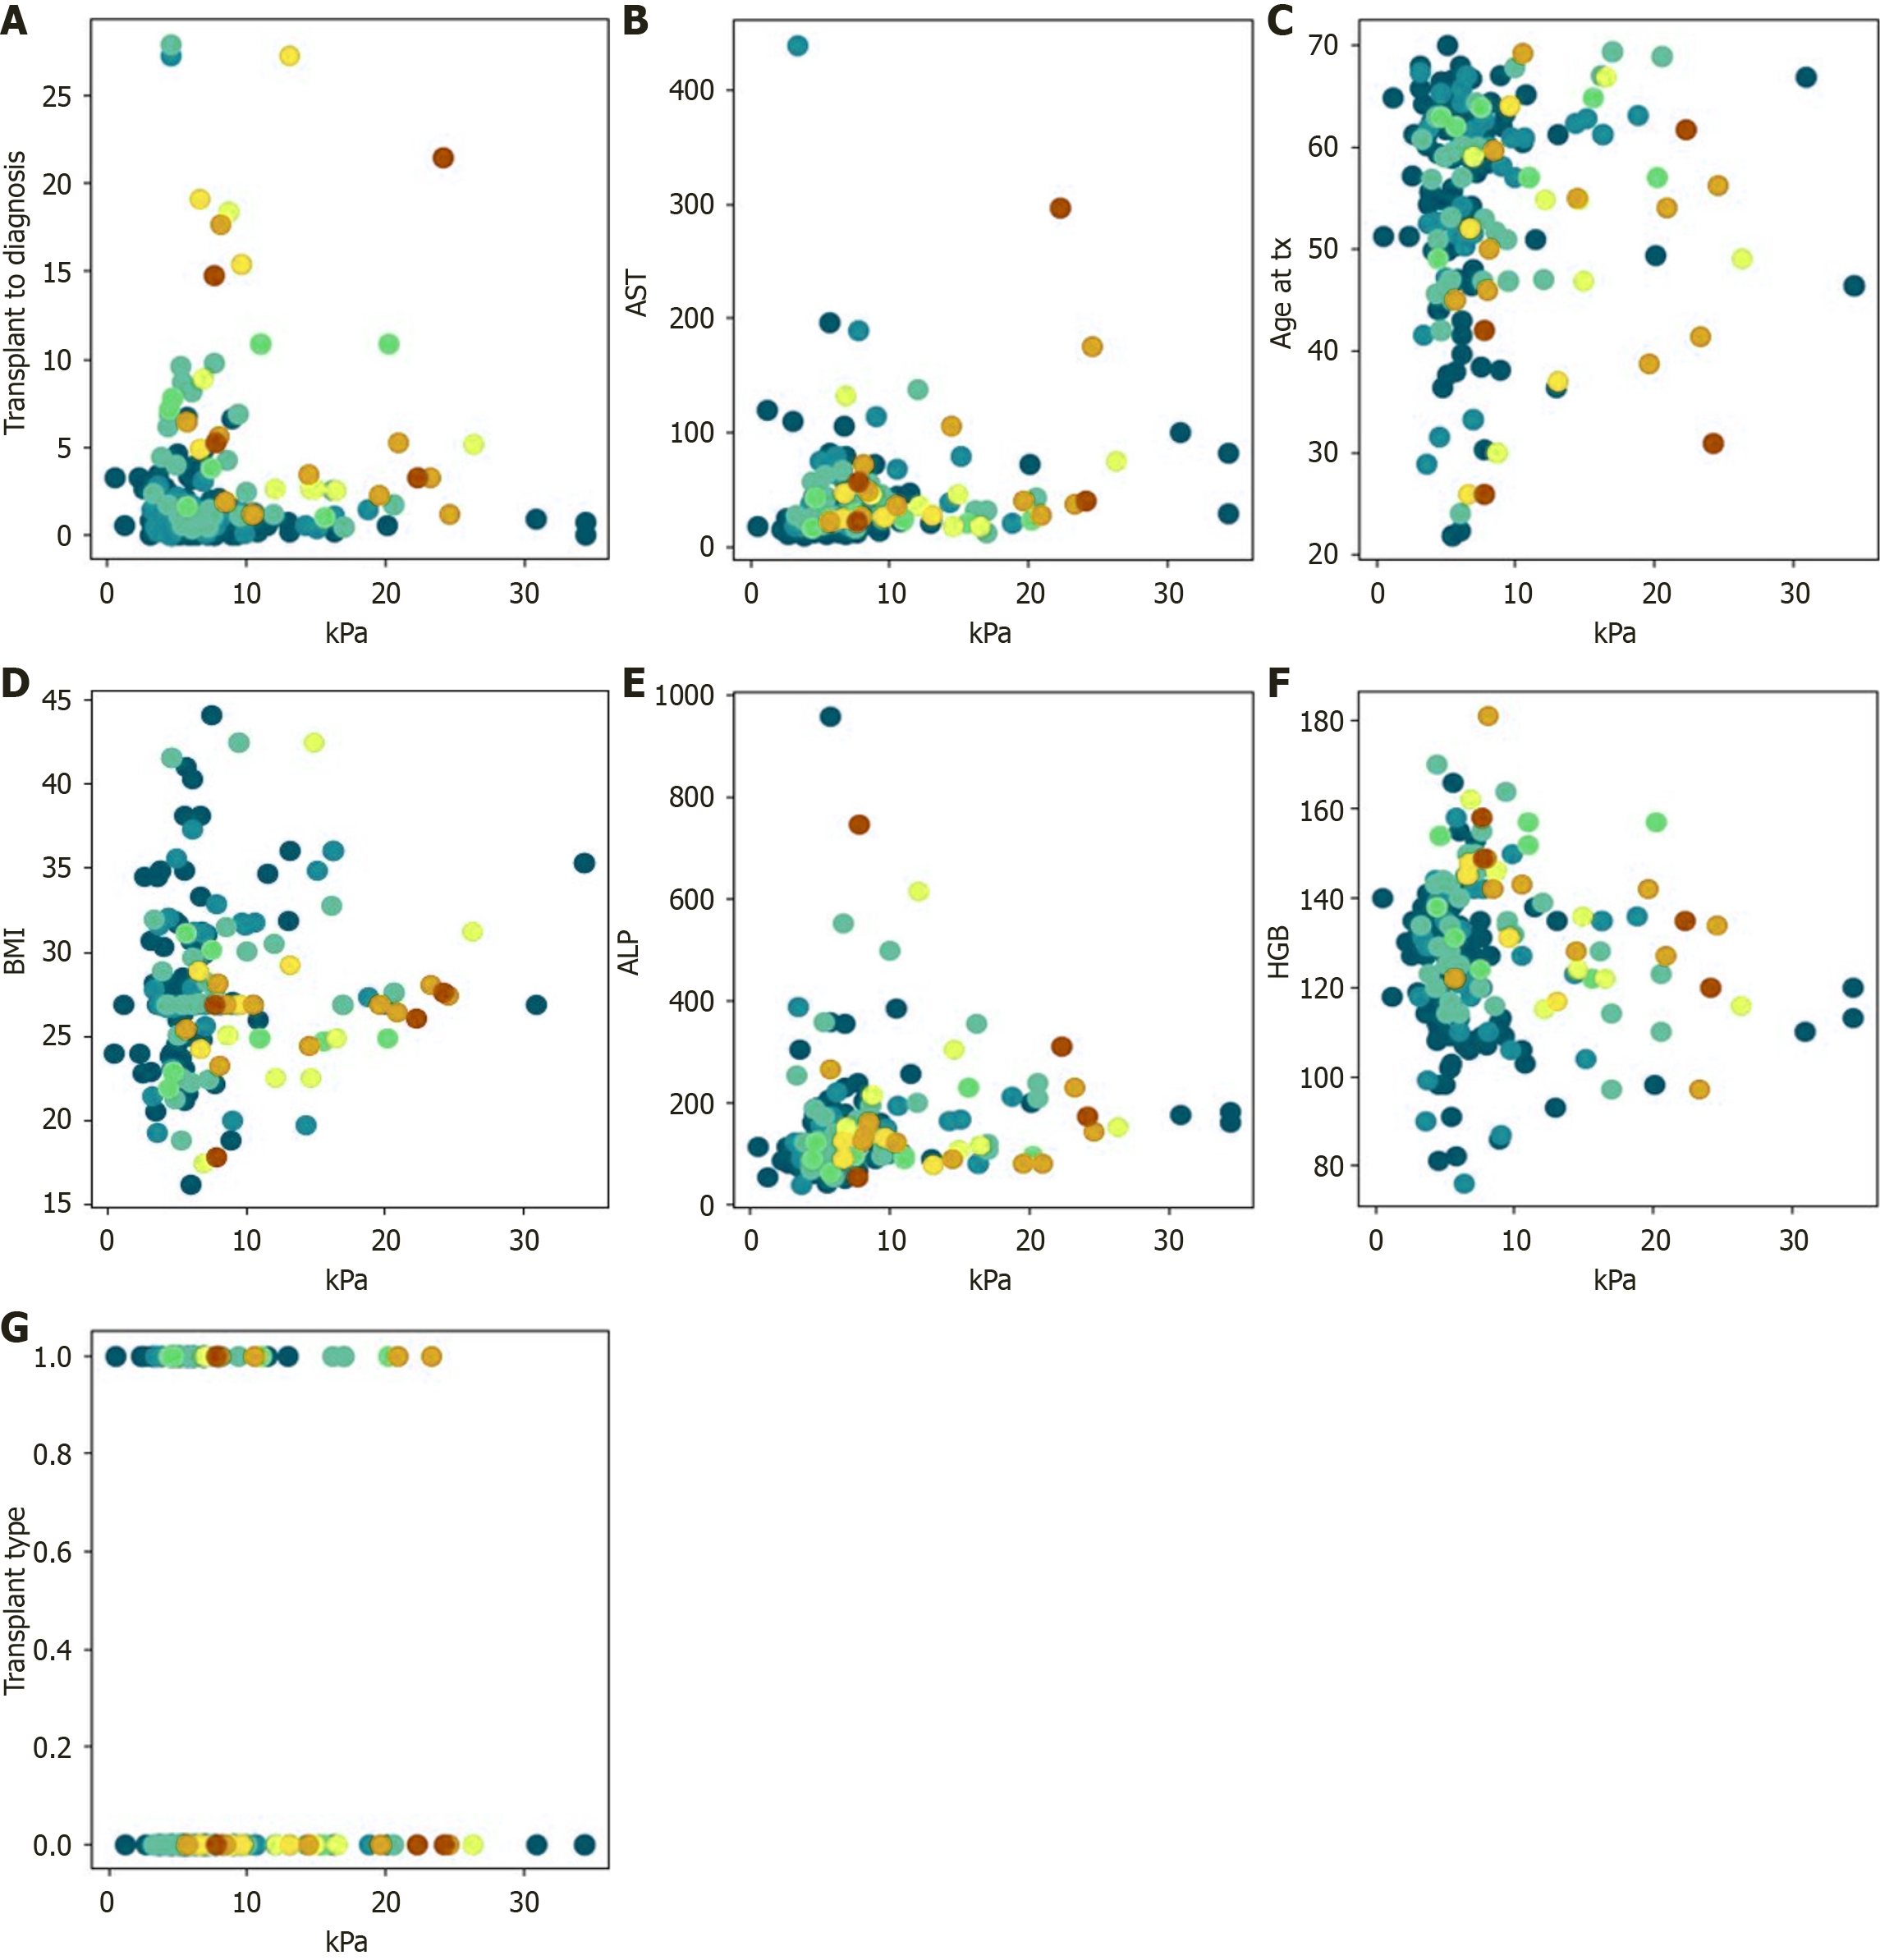
Figure 4 Rule-of-thumb scatter plots.
Scatter plots showing liver stiffness measurements (kPa) in relation to key predictive variables: A: Graft age; B: Aspartate aminotransferase; C: Patient age; D: Body mass index; E: Alkaline phosphatase; F: Hemoglobin; G: Donor type. Each point represents an individual patient. AST: Aspartate aminotransferase; BMI: Body mass index; ALP: Alkaline phosphatase; HGB: Hemoglobin.
- Citation: Koivu A, Azarfar G, Shojaee M, Hlaing NKT, Rizvi S, Sharma D, Maleki S, Bhat M. Machine learning model integrating transient elastography and clinical data for prediction of graft fibrosis after liver transplantation. World J Hepatol 2026; 18(6): 120258
- URL: https://www.wjgnet.com/1948-5182/full/v18/i6/120258.htm
- DOI: https://dx.doi.org/10.4254/wjh.120258