
















Copyright: ©Author(s) 2026.
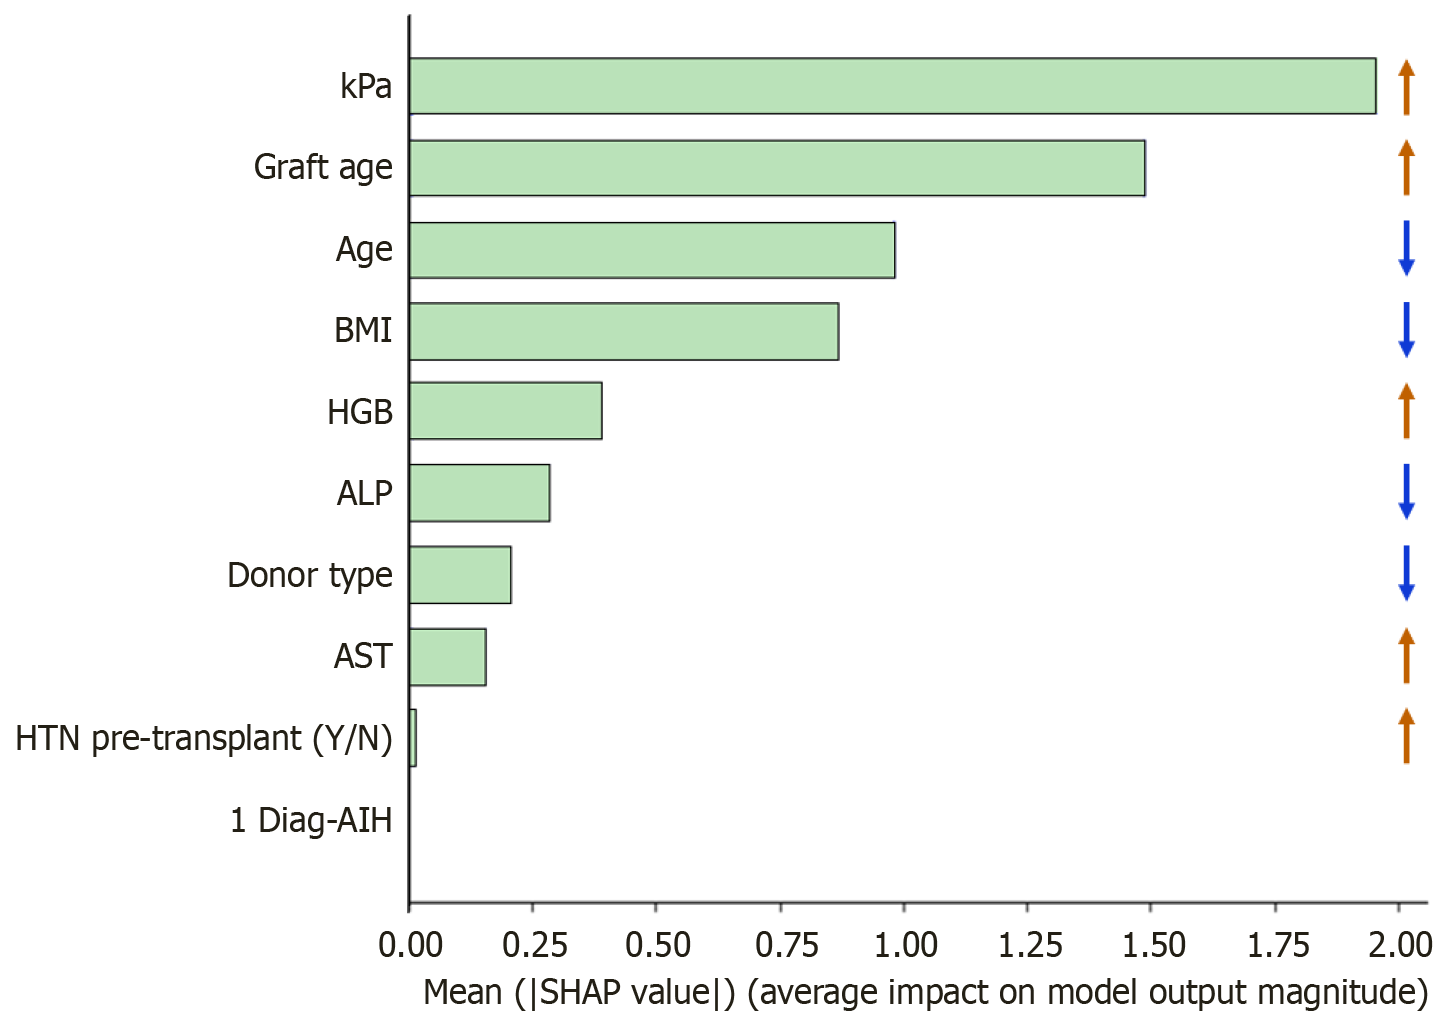
Figure 2 Mean SHapley Additive exPlanation values.
Feature importance plot for the 10 variables most associated with significant graft fibrosis for the best performing model (extreme gradient boosting). The higher the average SHapley Additive exPlanation value, the higher the contribution of the individual feature in predicting graft fibrosis. The direction of the association between top-ranked input variables and graft fibrosis is shown with arrows. Features highlighted in red signify an increased risk of graft fibrosis, while those depicted in blue indicate protective factors against fibrosis. BMI: Body mass index; HGB: Hemoglobin; ALP: Alkaline phosphatase; AST: Aspartate aminotransferase; HTN: Hypertension; Y: Yes; N: No; 1Diag-AIH: Type 1 autoimmune hepatitis diagnosis; SHAP: SHapley Additive exPlanations.
- Citation: Koivu A, Azarfar G, Shojaee M, Hlaing NKT, Rizvi S, Sharma D, Maleki S, Bhat M. Machine learning model integrating transient elastography and clinical data for prediction of graft fibrosis after liver transplantation. World J Hepatol 2026; 18(6): 120258
- URL: https://www.wjgnet.com/1948-5182/full/v18/i6/120258.htm
- DOI: https://dx.doi.org/10.4254/wjh.120258