
















Copyright: ©Author(s) 2026.
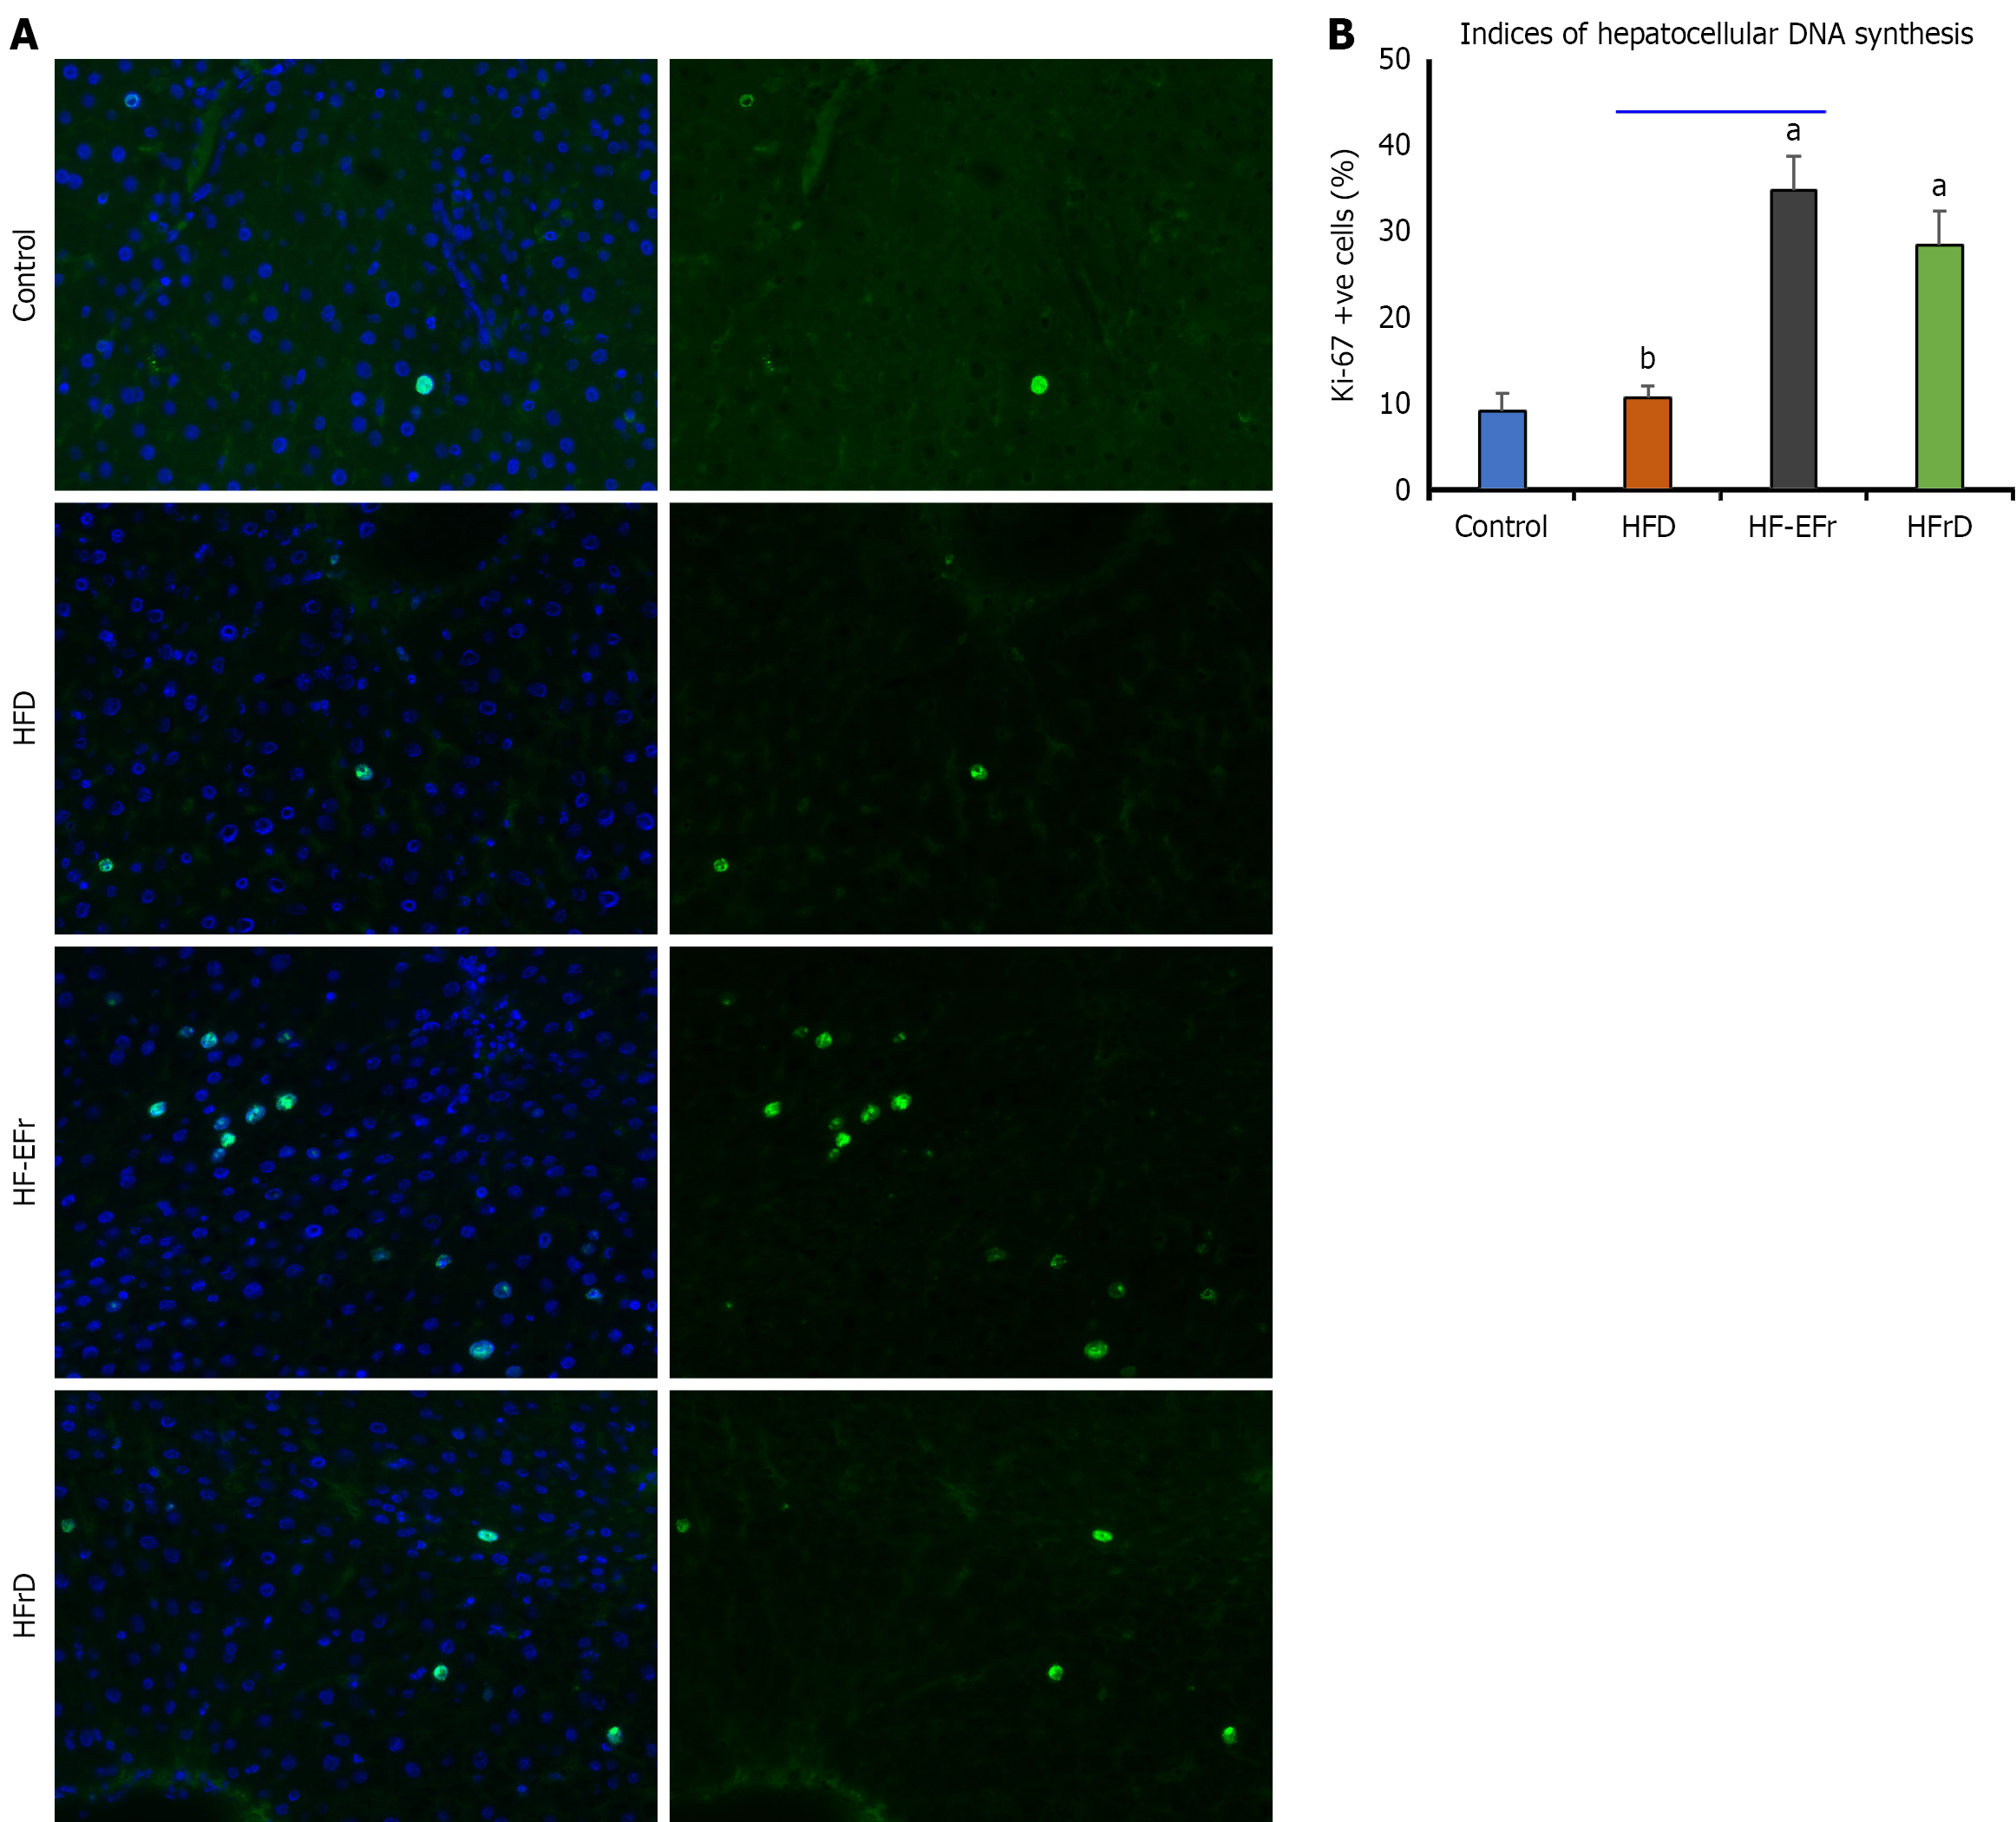
Figure 7 Indirect immunofluorescence staining for the proliferation marker Ki-67.
A: Representative liver sections show Ki-67-positive nuclei at week 4. DAPI was used for nuclear counterstaining (× 20); B: Indices of hepatocellular DNA synthesis were quantified as the percentage of Ki-67-positive cells across eight high-power fields per liver sample. Statistical analysis was performed using one-way ANOVA. Data are expressed as mean ± SEM (n = 5/group). aP < 0.05 vs control, bP < 0.05 vs HFD. HFD: High-fat diet; HF-EFr: High-fat plus ethanol and fructose; HFrD: High-fructose diet.
- Citation: Alwahsh SM, Xu M, Nabulsi M, Mihm S, Alzahrani FA, Ramadori GP. Differential impact of high-fructose and ethanol diets on early steatohepatitis and hepatic melanocortin-4 receptor responses in rats. World J Hepatol 2026; 18(6): 119792
- URL: https://www.wjgnet.com/1948-5182/full/v18/i6/119792.htm
- DOI: https://dx.doi.org/10.4254/wjh.119792