
















Copyright: ©Author(s) 2026.
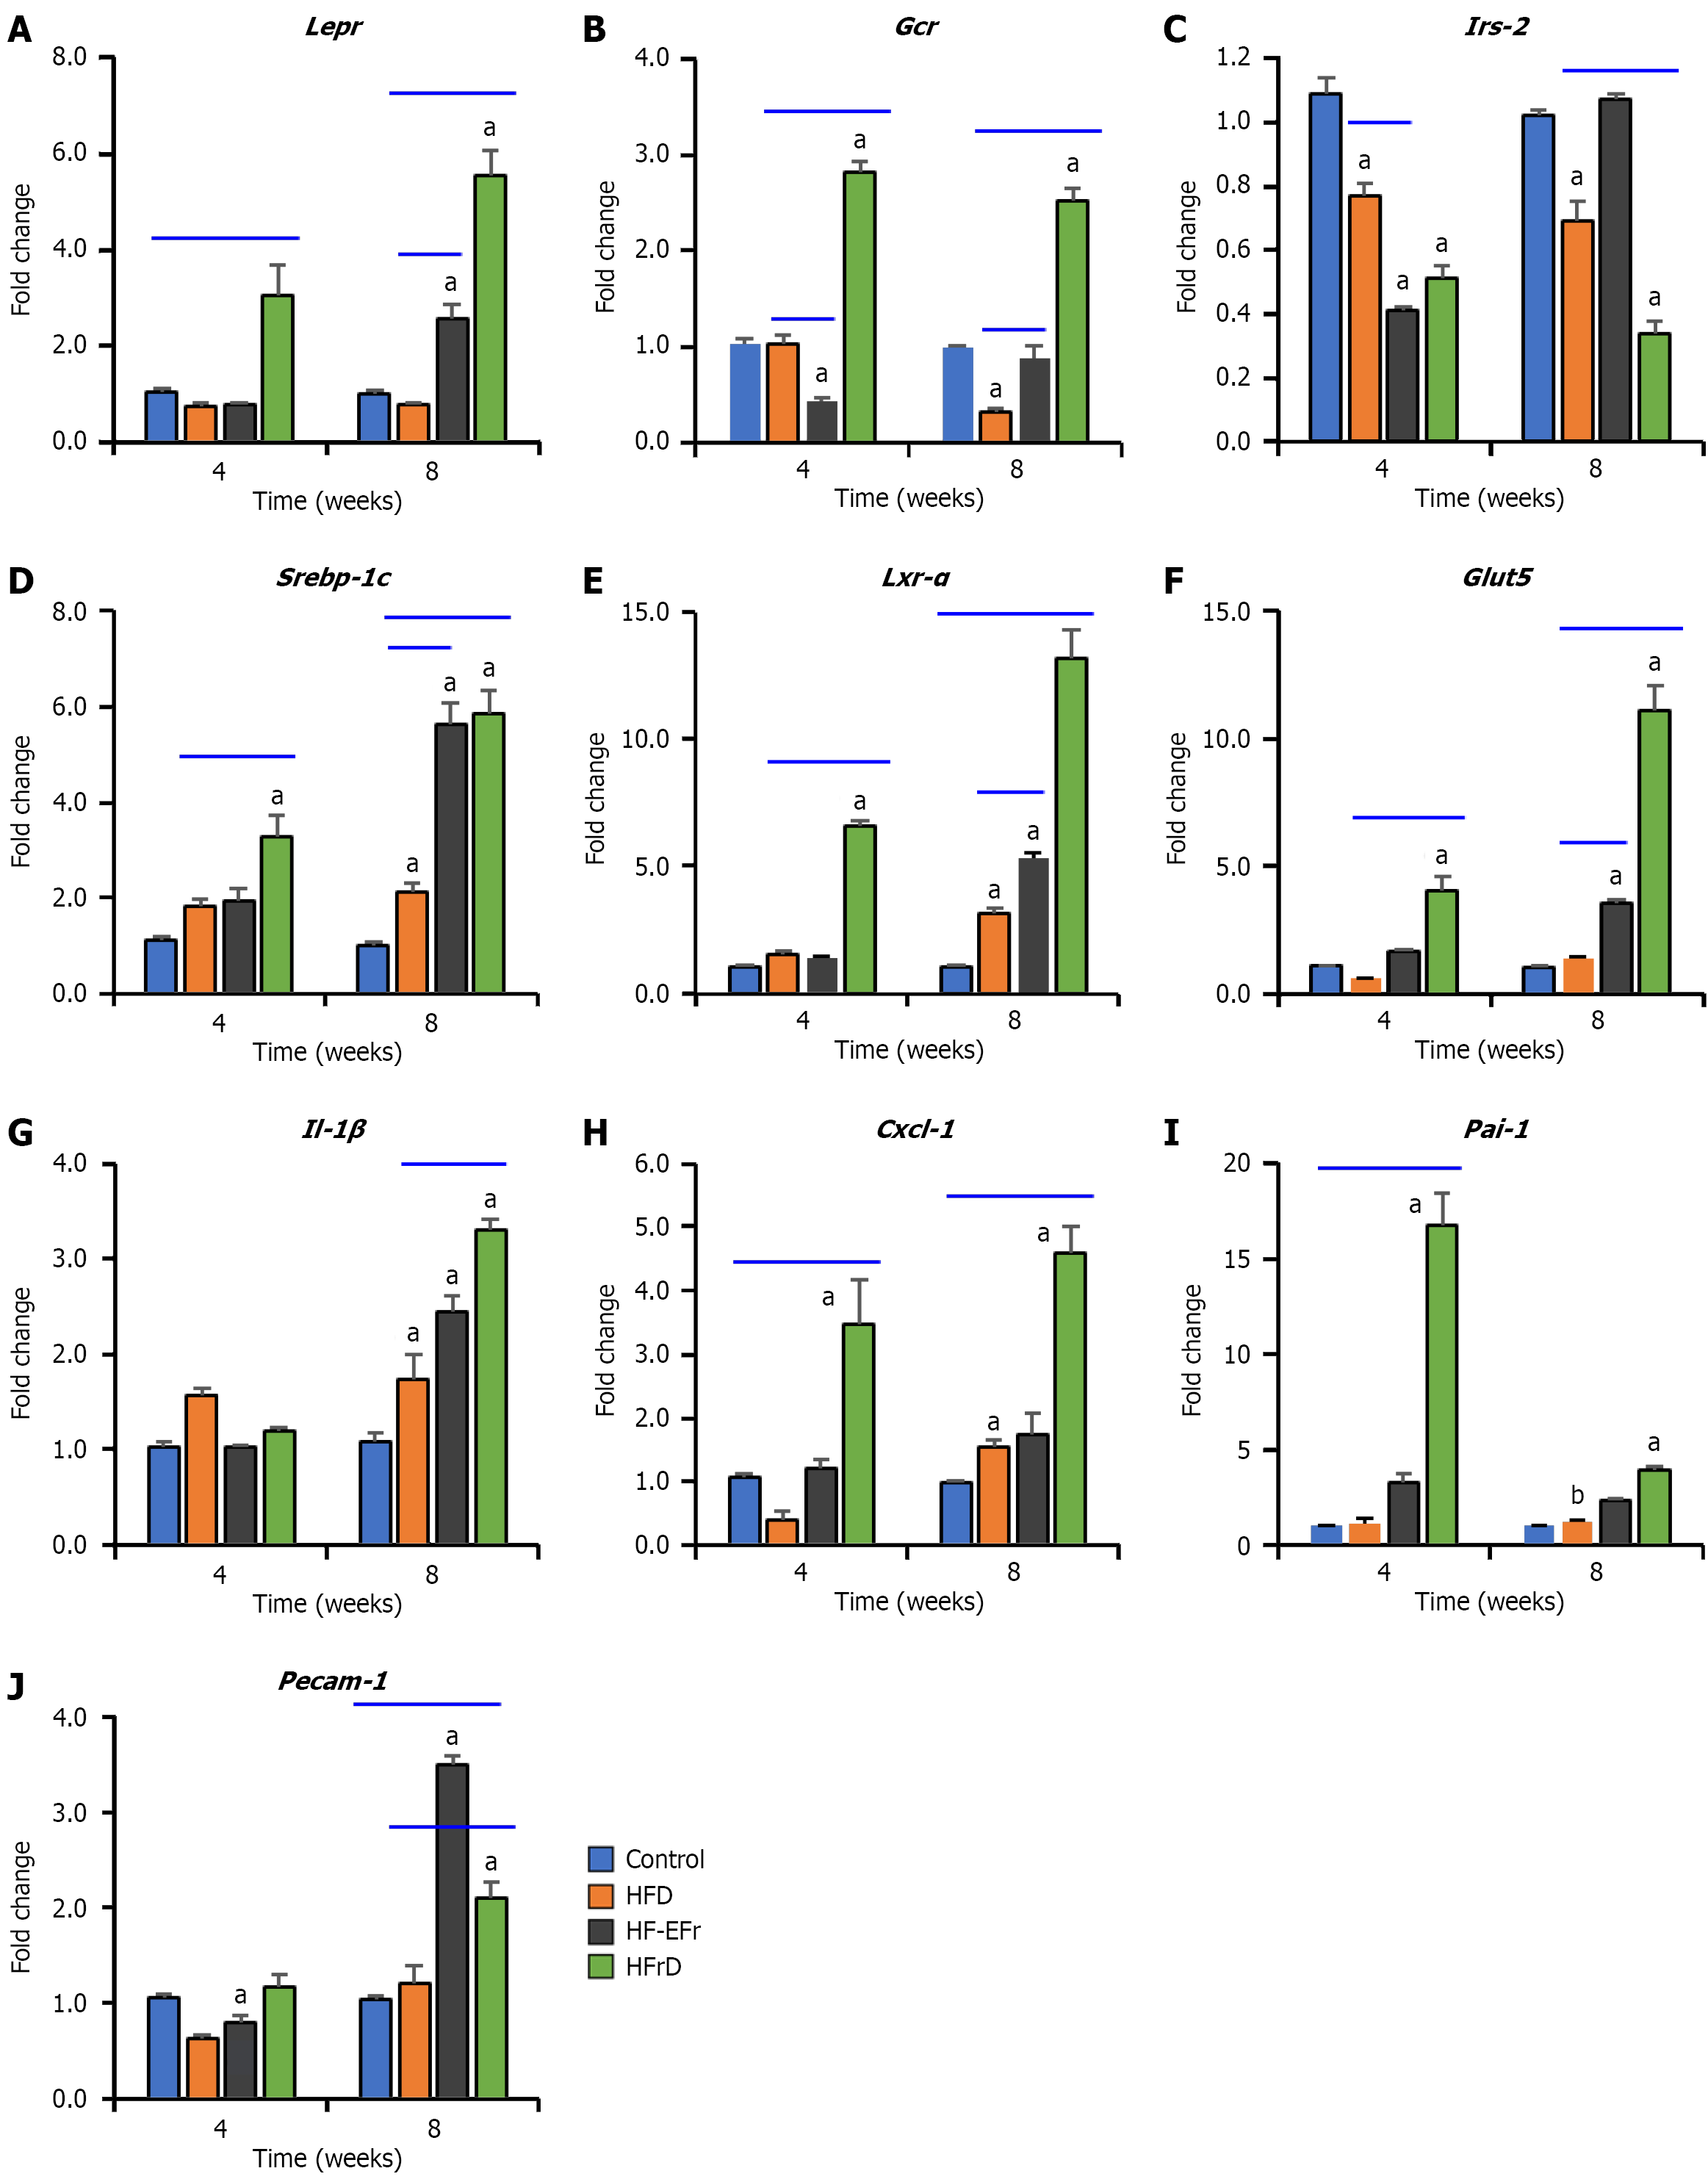
Figure 6 Relative gene expression in rat liver tissue following dietary intervention for 4 and 8 weeks, expressed as fold change to the control group.
A: Lepr; B: Gcr; C: Irs-2; D: Srebp-1c; E: Lxr-α; F: Glut5 fructose transporter; G: Il-1β; H: Cxcl-1 (chemokine); I: Pai-1; J: Pecam-1, highlighting differential metabolic, inflammatory, and endothelial responses across dietary interventions. aP < 0.05 vs control, bP < 0.05 vs HFD. Statistical analysis was performed using two-way ANOVA with Tukey’s post hoc test unless otherwise indicated. Data are expressed as mean ± SEM (n = 5/group). HFD: High-fat diet; HF-EFr: High-fat plus ethanol and fructose; HFrD: High-fructose diet.
- Citation: Alwahsh SM, Xu M, Nabulsi M, Mihm S, Alzahrani FA, Ramadori GP. Differential impact of high-fructose and ethanol diets on early steatohepatitis and hepatic melanocortin-4 receptor responses in rats. World J Hepatol 2026; 18(6): 119792
- URL: https://www.wjgnet.com/1948-5182/full/v18/i6/119792.htm
- DOI: https://dx.doi.org/10.4254/wjh.119792