
















Copyright: ©Author(s) 2026.
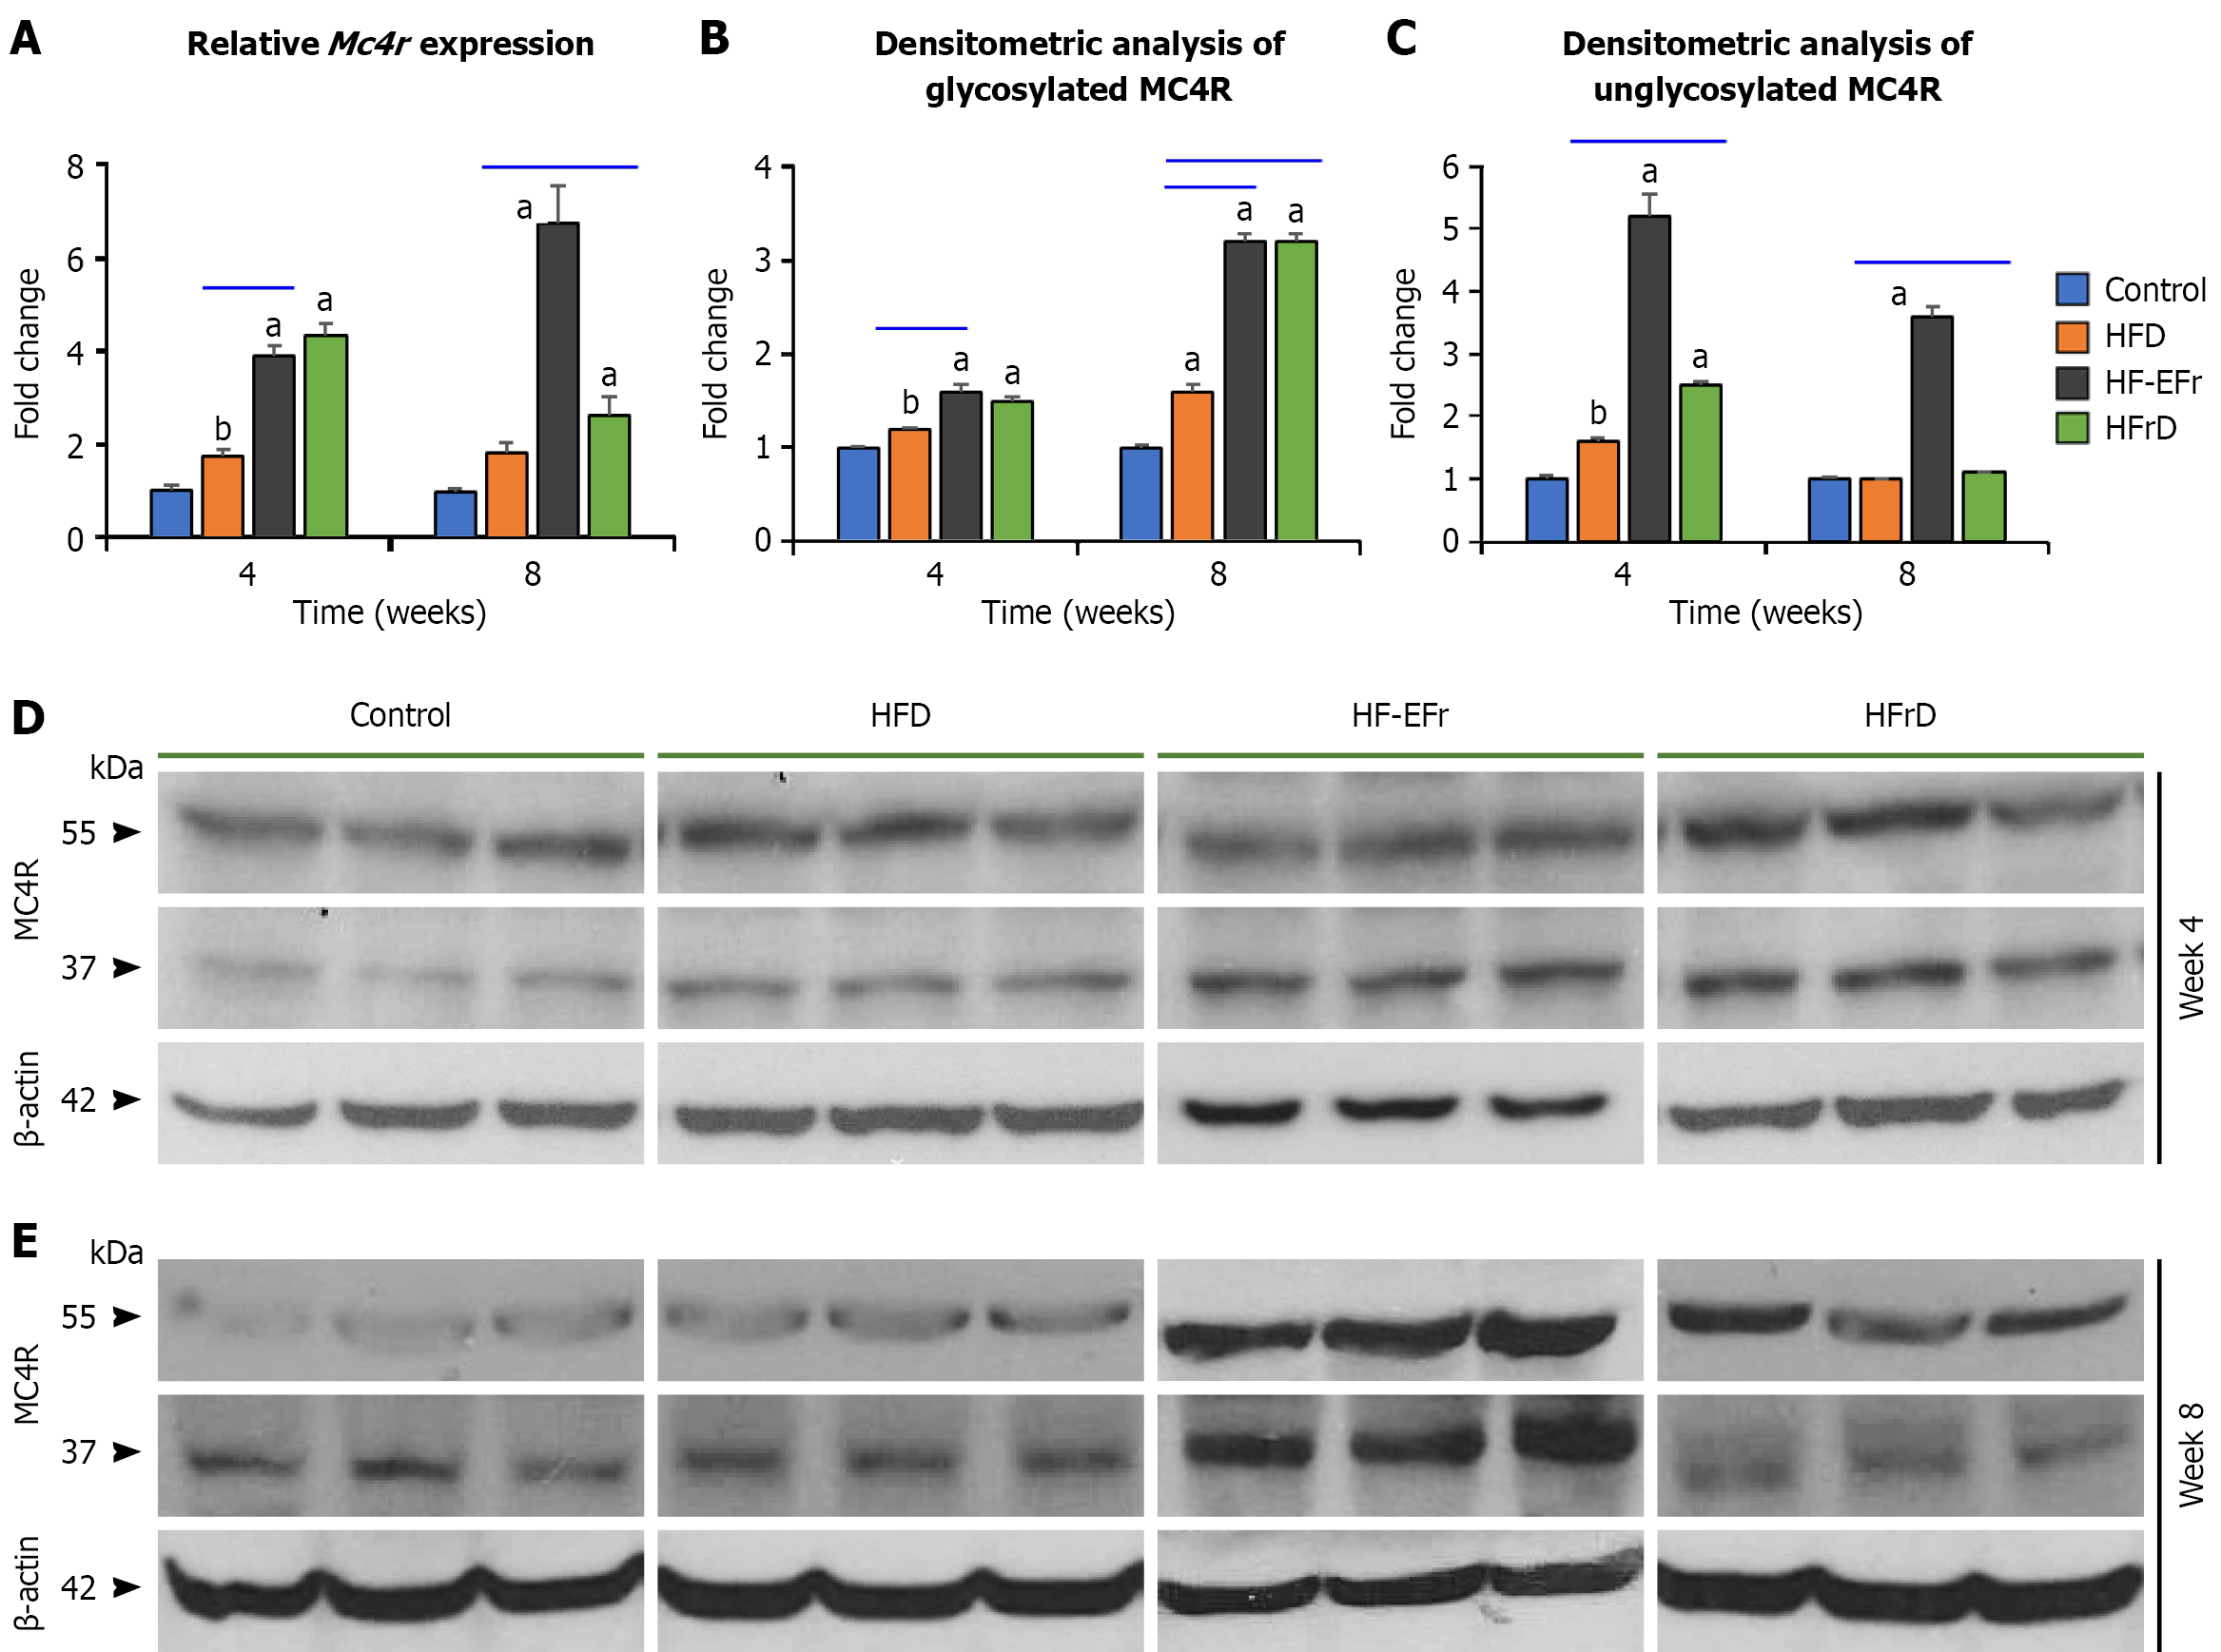
Figure 4 MC4R mRNA and protein expression dynamics exhibit diet- and time-dependent differences in glycosylation status.
A: MC4R mRNA levels determined by real-time reverse transcription PCR; B: Densitometric analysis of the mature (glycosylated) MC4R protein (55 kDa); C: Densitometric analysis of the immature (unglycosylated) MC4R protein (37 kDa). Data in panels A-C are expressed as fold change relative to the control group (Y-axis) at weeks 4 and 8 (X-axis); D and E: Representative western blots of MC4R (55 kDa and 37 kDa) and β-actin (42 kDa, loading control) in hepatic lysates (75 µg protein per lane resolved by SDS-PAGE) at week 4 and week 8 from control, high-fat diet, high-fat plus ethanol and fructose, and modified Lieber-DeCarli high-fructose diet groups. Band intensities were quantified by densitometry using ImageJ. MC4R intensities were normalized to β-actin, and fold changes were calculated relative to the mean of the corresponding control group at each time point. Data represent mean ± SEM of independent samples. aP < 0.05 vs control, bP < 0.05 vs HFD. HFD: High-fat diet; HF-EFr: High-fat plus ethanol and fructose; HFrD: High-fructose diet.
- Citation: Alwahsh SM, Xu M, Nabulsi M, Mihm S, Alzahrani FA, Ramadori GP. Differential impact of high-fructose and ethanol diets on early steatohepatitis and hepatic melanocortin-4 receptor responses in rats. World J Hepatol 2026; 18(6): 119792
- URL: https://www.wjgnet.com/1948-5182/full/v18/i6/119792.htm
- DOI: https://dx.doi.org/10.4254/wjh.119792