
















Copyright: ©Author(s) 2026.
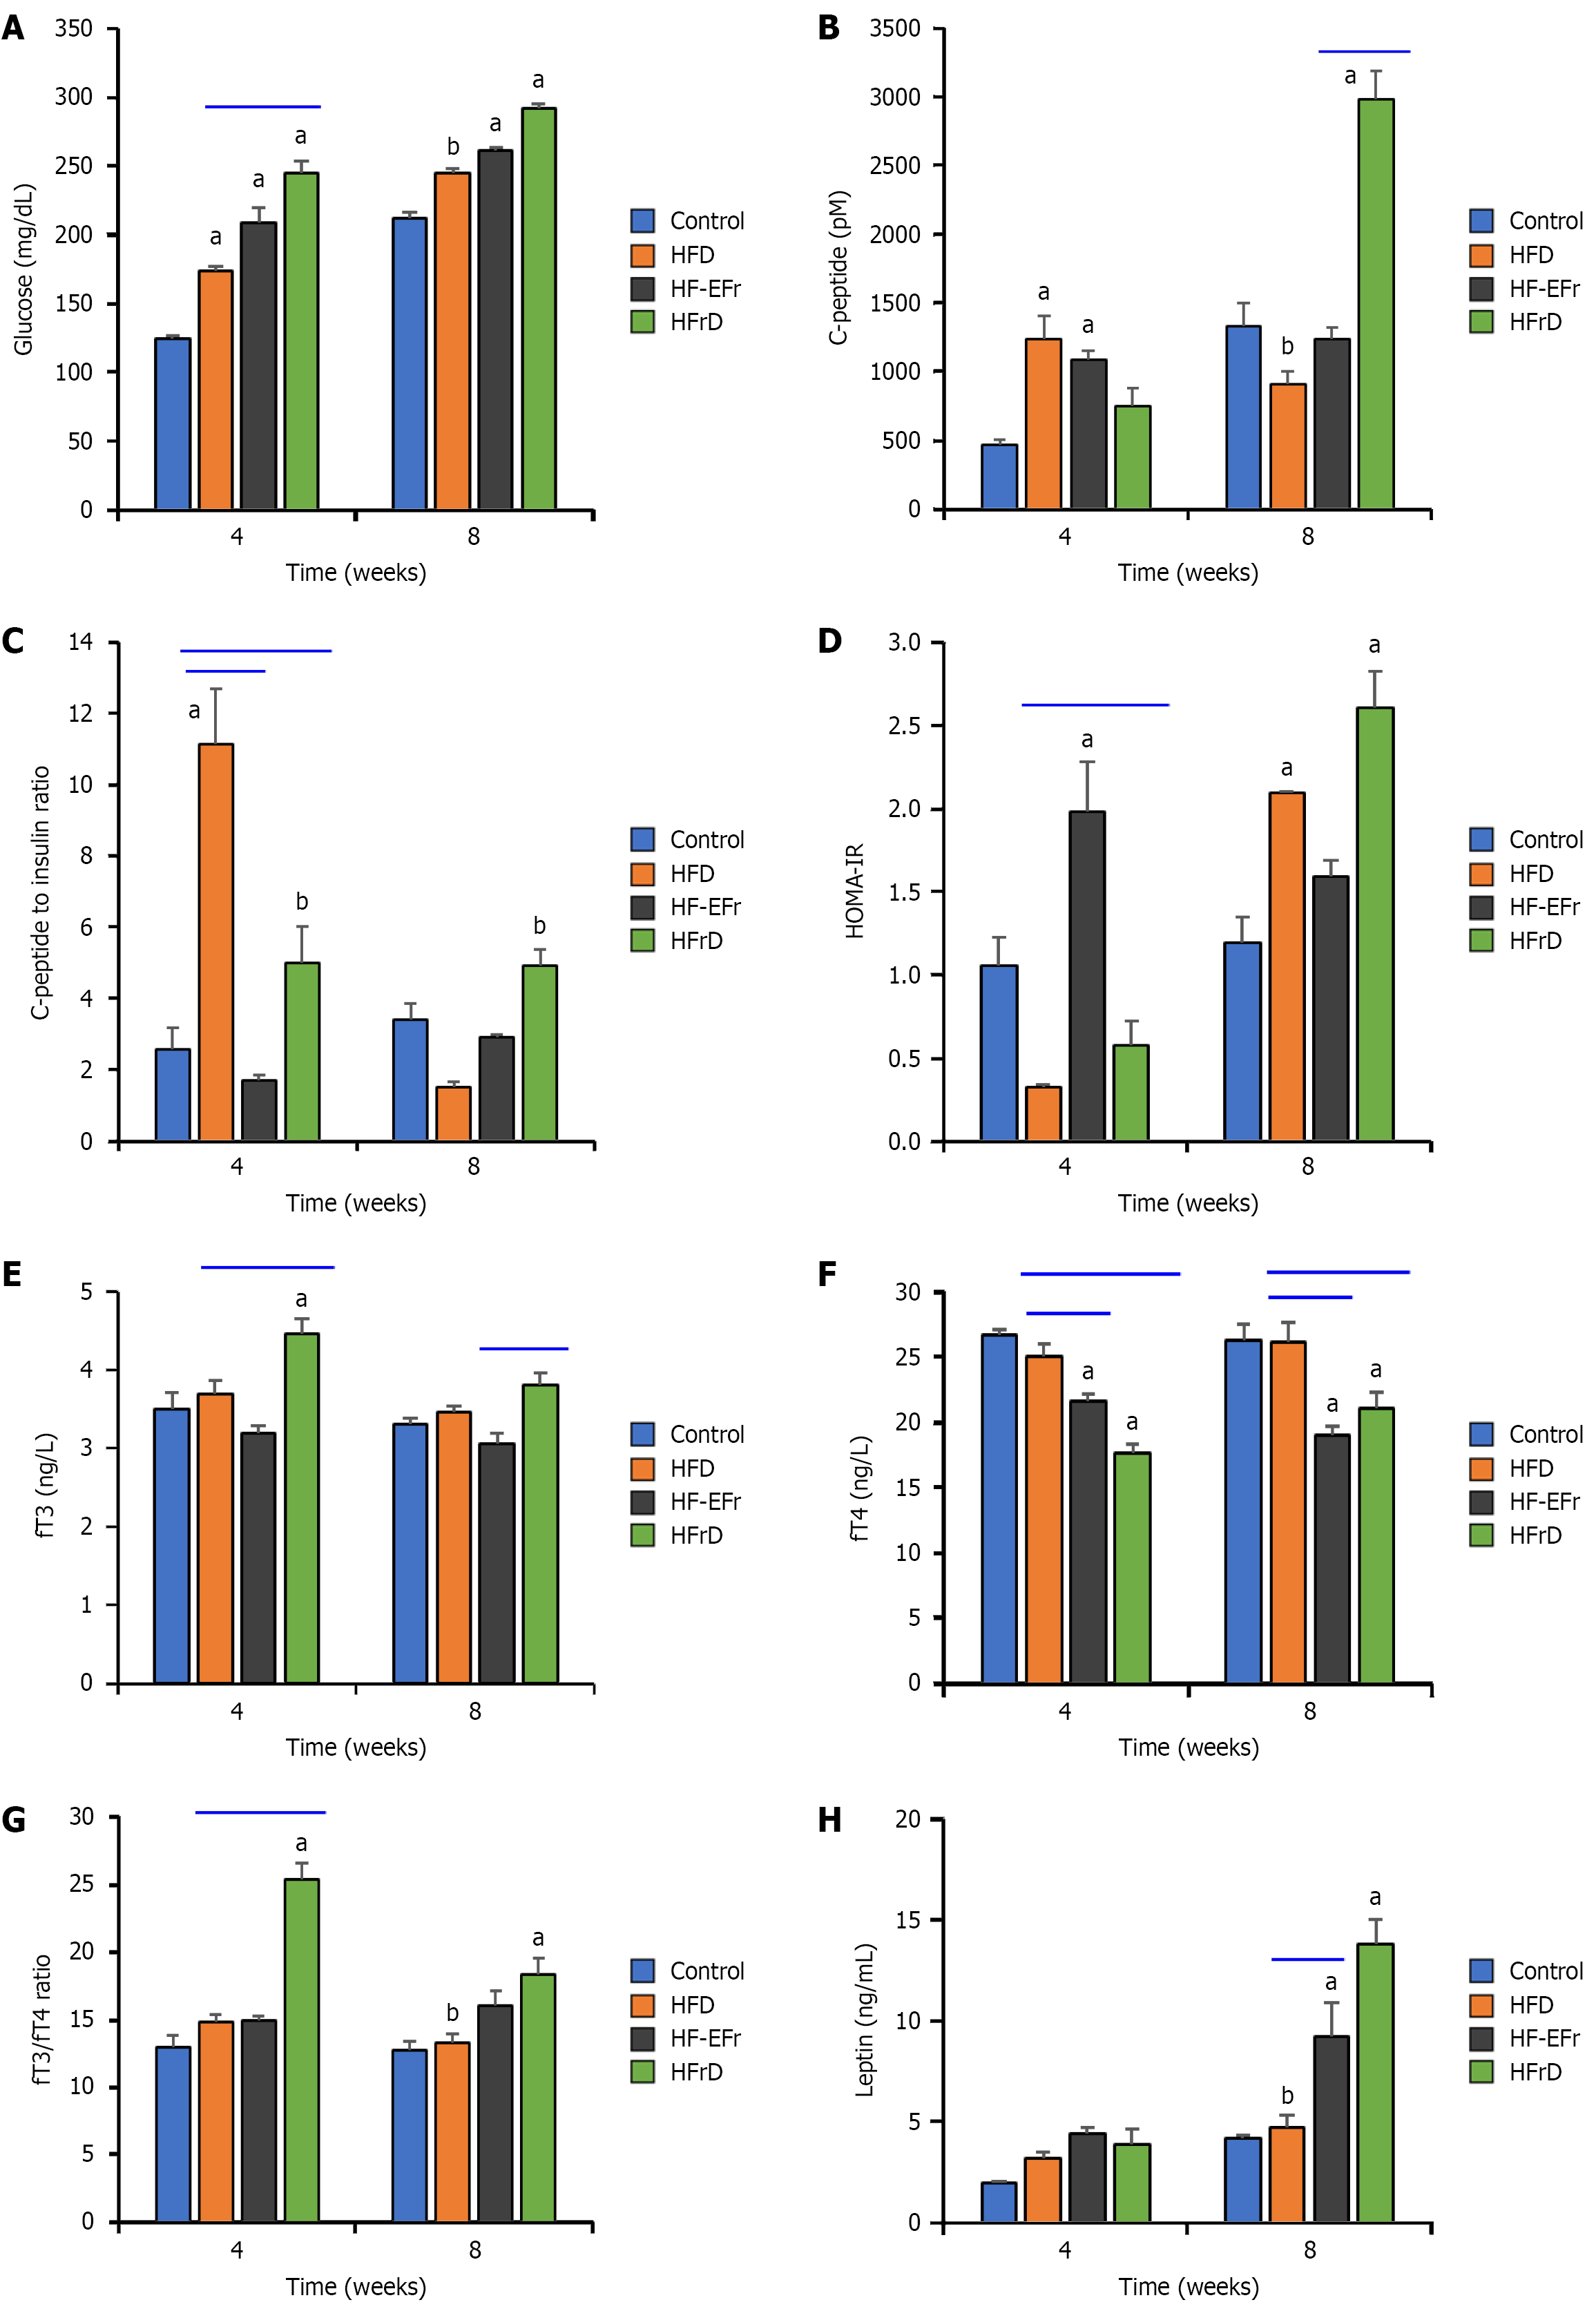
Figure 3 Fructose diets induce systemic dysregulation of glucose level, β-cell function, leptin, and the thyroid hormone homeostasis.
A: Fasting serum glucose levels; B: C-peptide level; C: C-peptide-to-insulin ratio (index of hepatic insulin clearance); D: Homeostatic Model Assessment for Insulin Resistance (HOMA-IR); E: Serum free triiodothyronine (fT3); F: Serum free thyroxine (fT4); G: FT3/fT4 ratio (index of T4-to-T3 peripheral conversion); H: Fasting circulating leptin levels, as a surrogate marker of adiposity, positively correlating with total body fat mass. aP < 0.05 vs control, bP < 0.05 vs HFrD. HFD: High-fat diet; HF-EFr: High-fat plus ethanol and fructose; HFrD: High-fructose diet.
- Citation: Alwahsh SM, Xu M, Nabulsi M, Mihm S, Alzahrani FA, Ramadori GP. Differential impact of high-fructose and ethanol diets on early steatohepatitis and hepatic melanocortin-4 receptor responses in rats. World J Hepatol 2026; 18(6): 119792
- URL: https://www.wjgnet.com/1948-5182/full/v18/i6/119792.htm
- DOI: https://dx.doi.org/10.4254/wjh.119792