
















Copyright: ©Author(s) 2026.
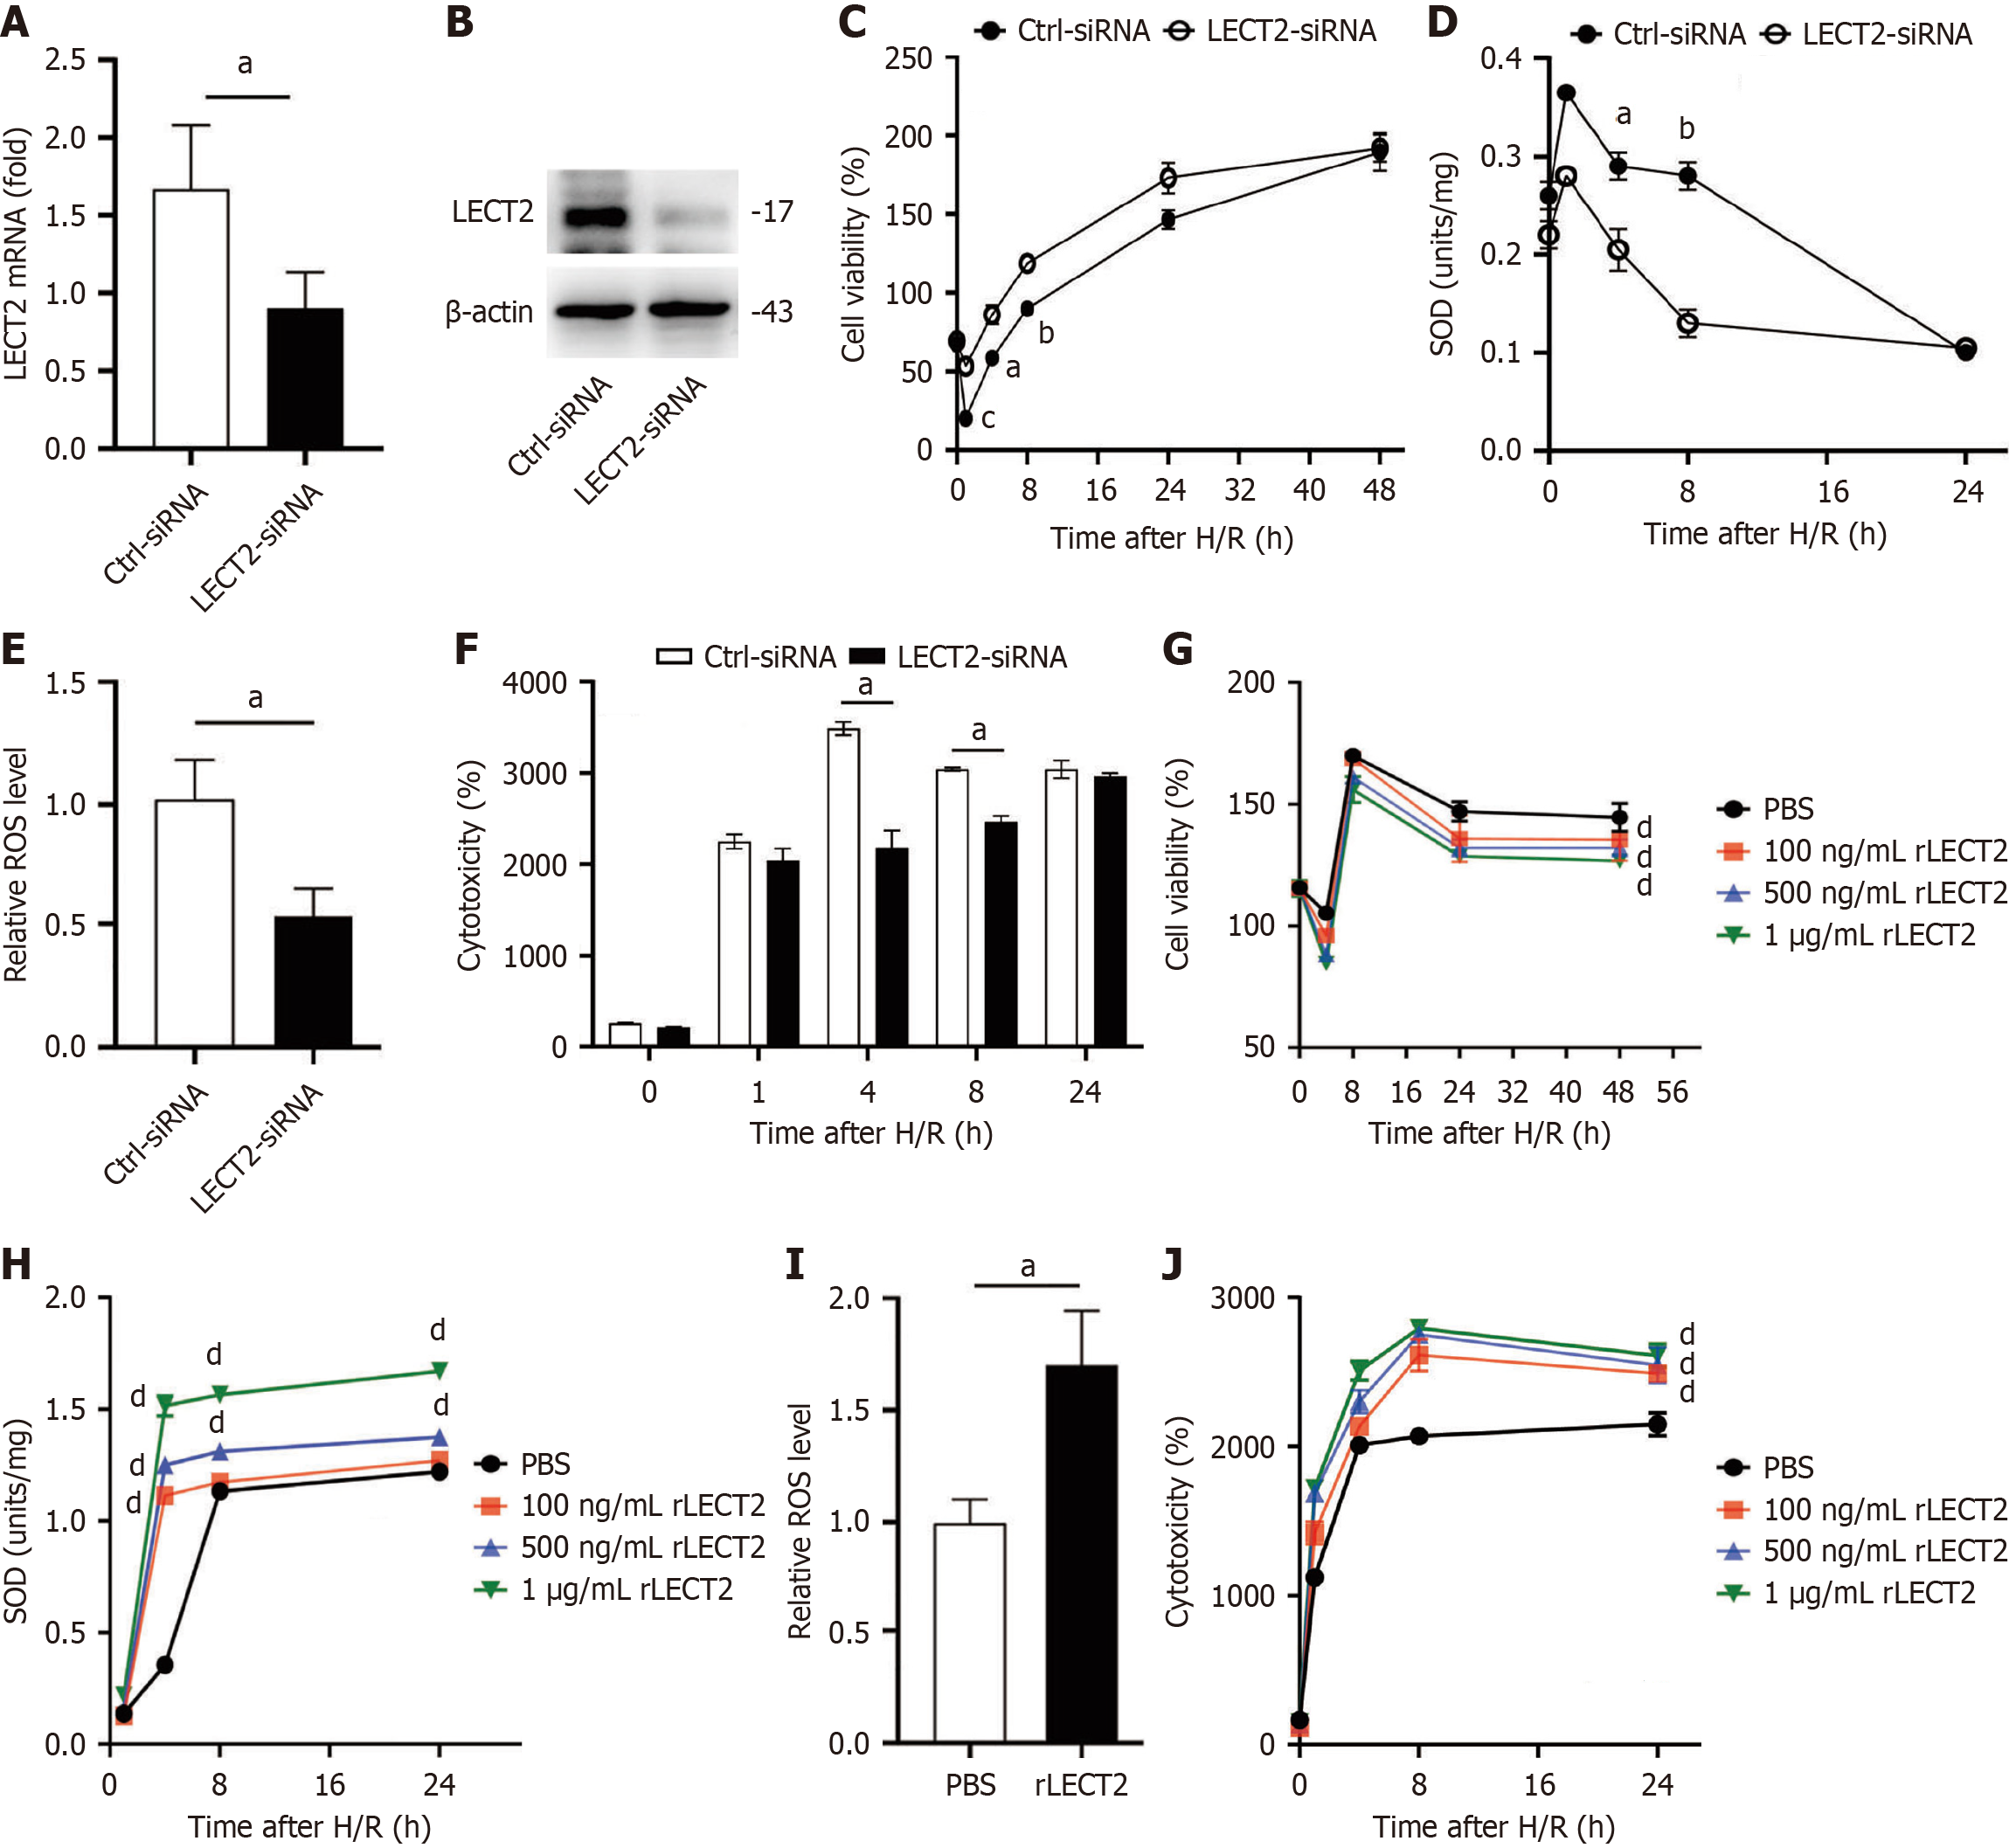
Figure 1 Knockdown of leukocyte-derived chemotaxin-2 mitigates and recombinant-leukocyte-derived chemotaxin-2 aggravates hypoxia-reoxygenation injury in EA.
hy926 cells. A: MRNA expression of leukocyte-derived chemotaxin-2 (LECT2) decreased after transfection with LECT2-small interfering RNA (siRNA) into EA.hy926 cells. Student’s t-test; B: Protein level of the LECT2 decreased after transfection with LECT2-siRNA into EA.hy926 cells; C: A cell counting kit 8 assay was used to assess cell proliferation capacity at different time points during reoxygenation after 8 hours of hypoxia. Student’s t-test; D: Superoxide dismutase activity was measured at different time points during reoxygenation after 8 hours of hypoxia to assess the level of cellular oxidative stress. Student’s t-test; E: Reactive oxygen species levels were measured in EA.hy926 cells at 8 hours post-reoxygenation following treatment with LECT2-siRNA or control siRNA. Student’s t-test; F: Lactate dehydrogenase levels were measured at different time points during reoxygenation after 8 hours of hypoxia to assess cellular cytotoxicity. Student’s t-test; G: A cell counting kit assay was used to assess cell proliferation capacity at different time points during reoxygenation after 8 hours of hypoxia. Two-way ANOVA; H: Superoxide dismutase activity was measured at different time points during reoxygenation after 8 hours of hypoxia to assess the level of cellular oxidative stress. Two-way ANOVA; I: Reactive oxygen species levels were measured in EA.hy926 cells at 8 hours post-reoxygenation following treatment with recombinant LECT2 or phosphate buffered saline. Student’s t-test; J: Lactate dehydrogenase levels were measured at different time points during reoxygenation after 8 hours of hypoxia to assess cellular cytotoxicity. Two-way ANOVA. Data are representative of three independent experiments. All data are presented as the mean ± SEM. aP < 0.05, bP < 0.01, cP < 0.0001, and dP < 0.05 vs phosphate buffered saline. LECT2: Leukocyte-derived chemotaxin-2; siRNA: Small interfering RNA; PBS: Phosphate buffered saline; ROS: Reactive oxygen species; SOD: Superoxide dismutase; H/R: Hypoxia/reoxygenation.
- Citation: Yang Y, Wu SL, Huang ZH, Dong MQ, Liu ZM, Xu M, Gao Y, Zhou WJ, Lin Y. LECT2/Tie1/Src signaling regulates the oxidative stress response in endothelial cells and liver ischemia-reperfusion injury. World J Hepatol 2026; 18(6): 119561
- URL: https://www.wjgnet.com/1948-5182/full/v18/i6/119561.htm
- DOI: https://dx.doi.org/10.4254/wjh.119561