
















Copyright: ©Author(s) 2026.
World J Hepatol. May 27, 2026; 18(5): 118040
Published online May 27, 2026. doi: 10.4254/wjh.v18.i5.118040
Published online May 27, 2026. doi: 10.4254/wjh.v18.i5.118040
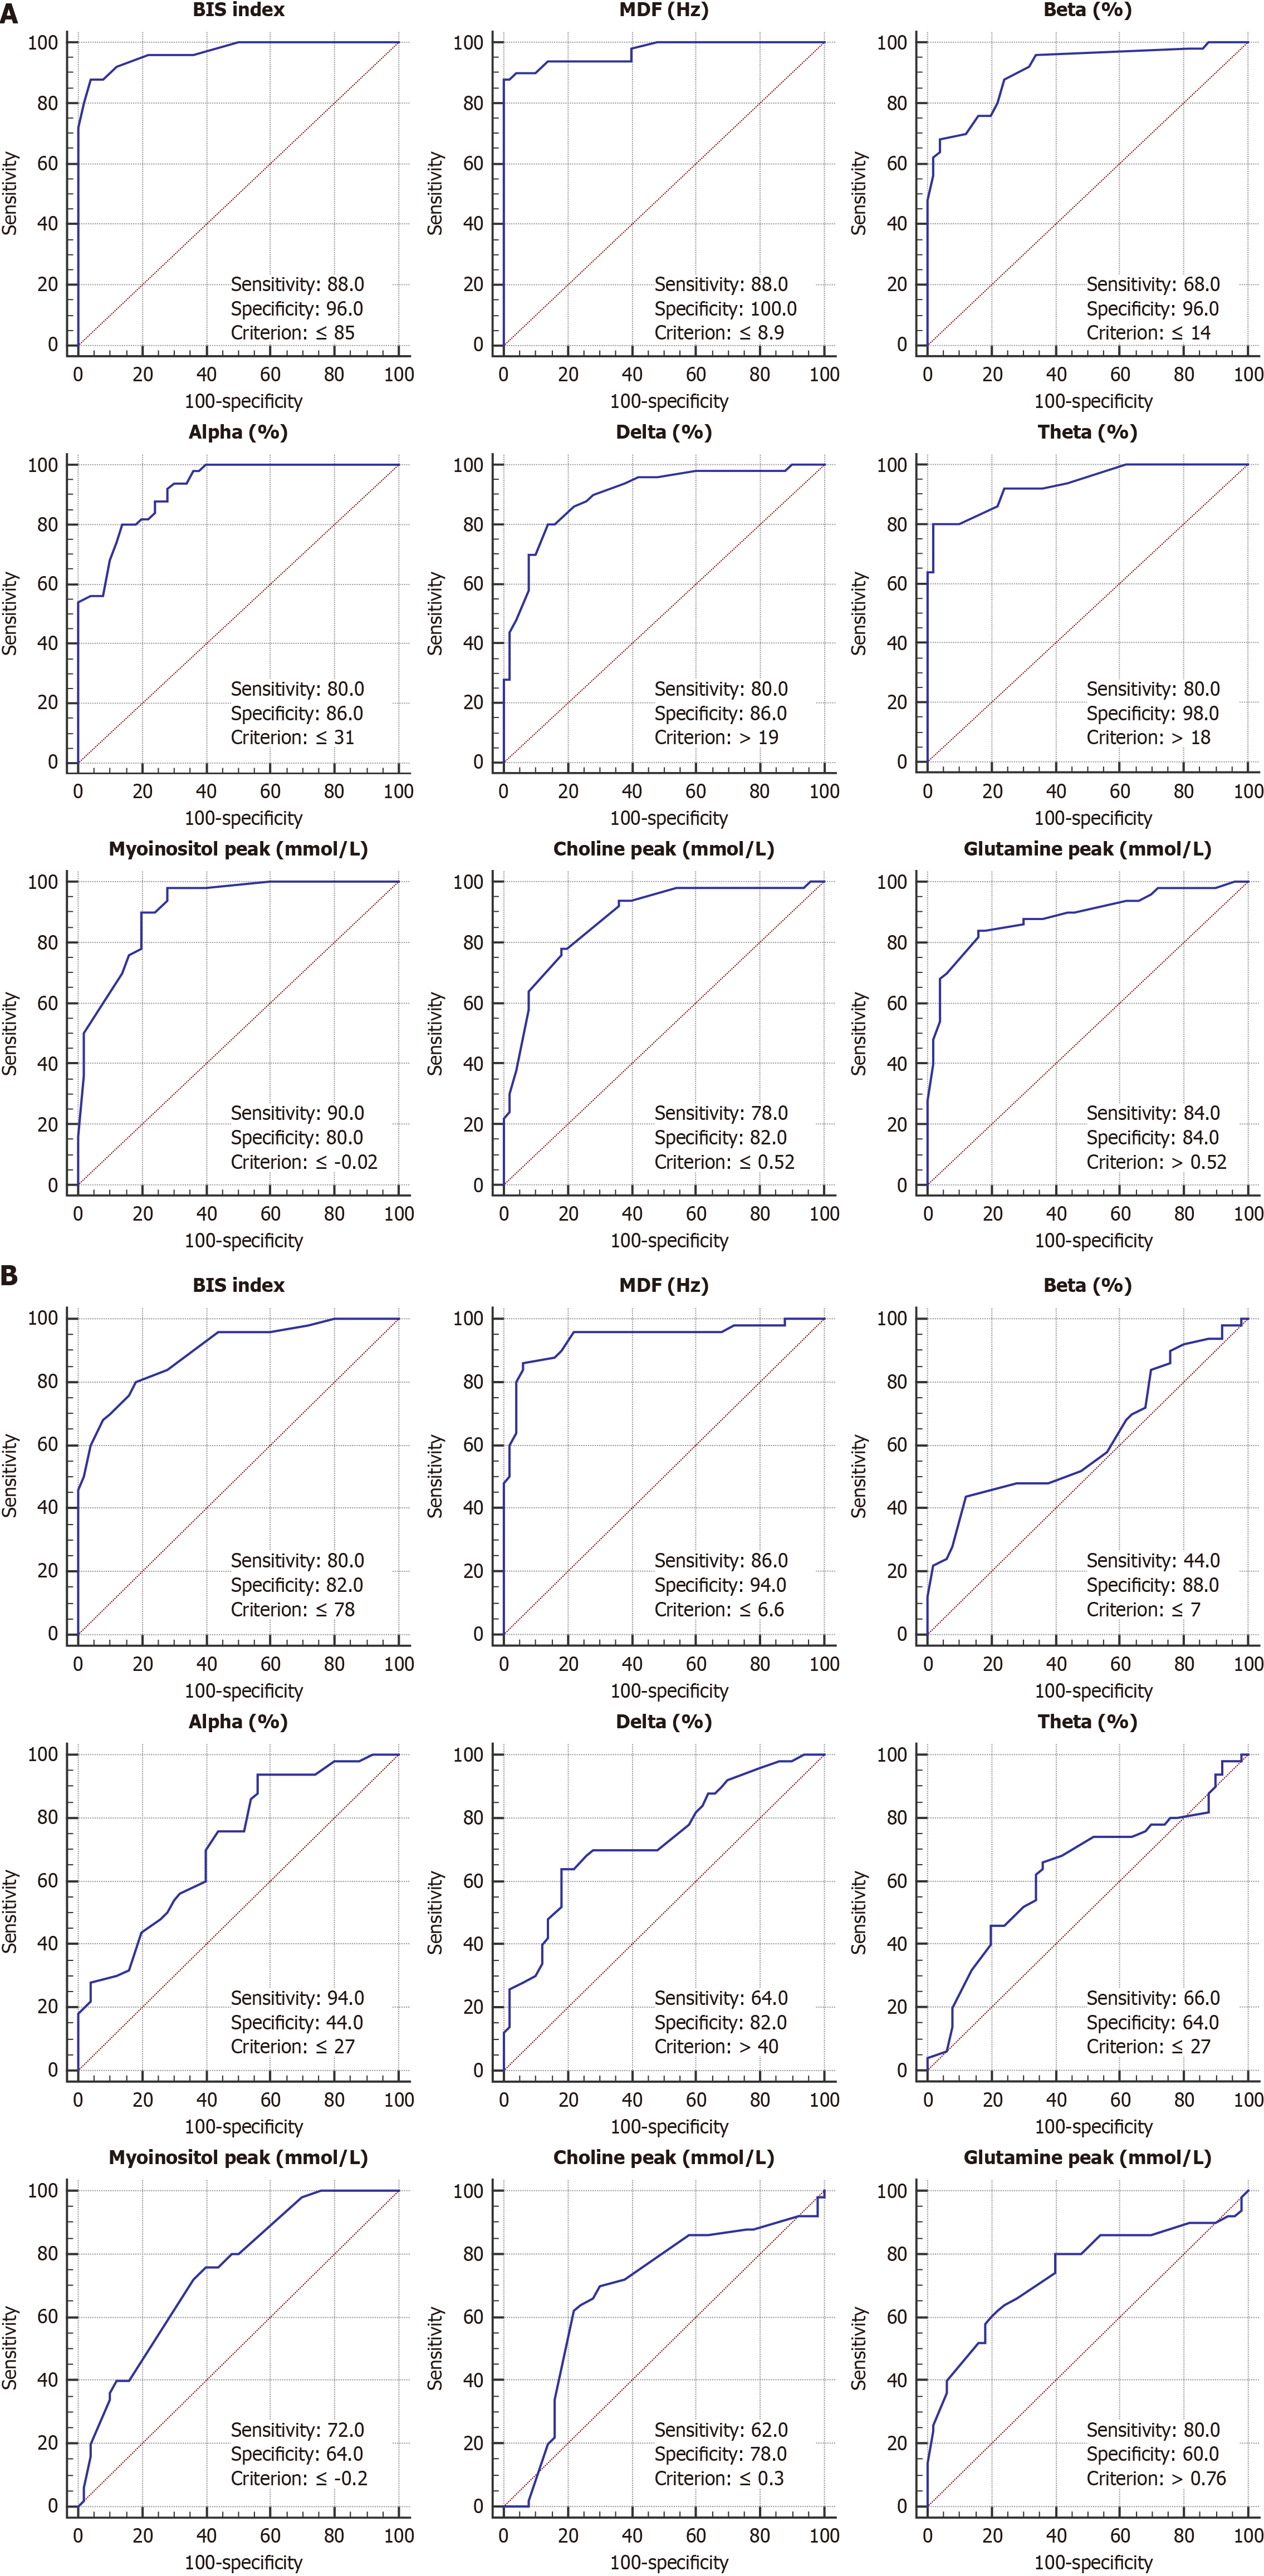
Figure 3 Receiver operating characteristic curves of Bispectral index, mean dominant frequency, relative powers of electroen
- Citation: Kummetha LC, Bhatt S, Vaithiyam V, Sharma BC, Srivastava S, Mahajan B, Bansal K, Chaudhry N, Tandon MS, Sachdeva S, Kumar A, Dalal A, Sonika U. Differentiation of minimal and grade 1 hepatic encephalopathy using neurophysiological, neuropsychological, magnetic resonance spectroscopic, and systemic inflammatory parameters. World J Hepatol 2026; 18(5): 118040
- URL: https://www.wjgnet.com/1948-5182/full/v18/i5/118040.htm
- DOI: https://dx.doi.org/10.4254/wjh.v18.i5.118040