
















Copyright: ©Author(s) 2026.
World J Hepatol. May 27, 2026; 18(5): 116995
Published online May 27, 2026. doi: 10.4254/wjh.v18.i5.116995
Published online May 27, 2026. doi: 10.4254/wjh.v18.i5.116995
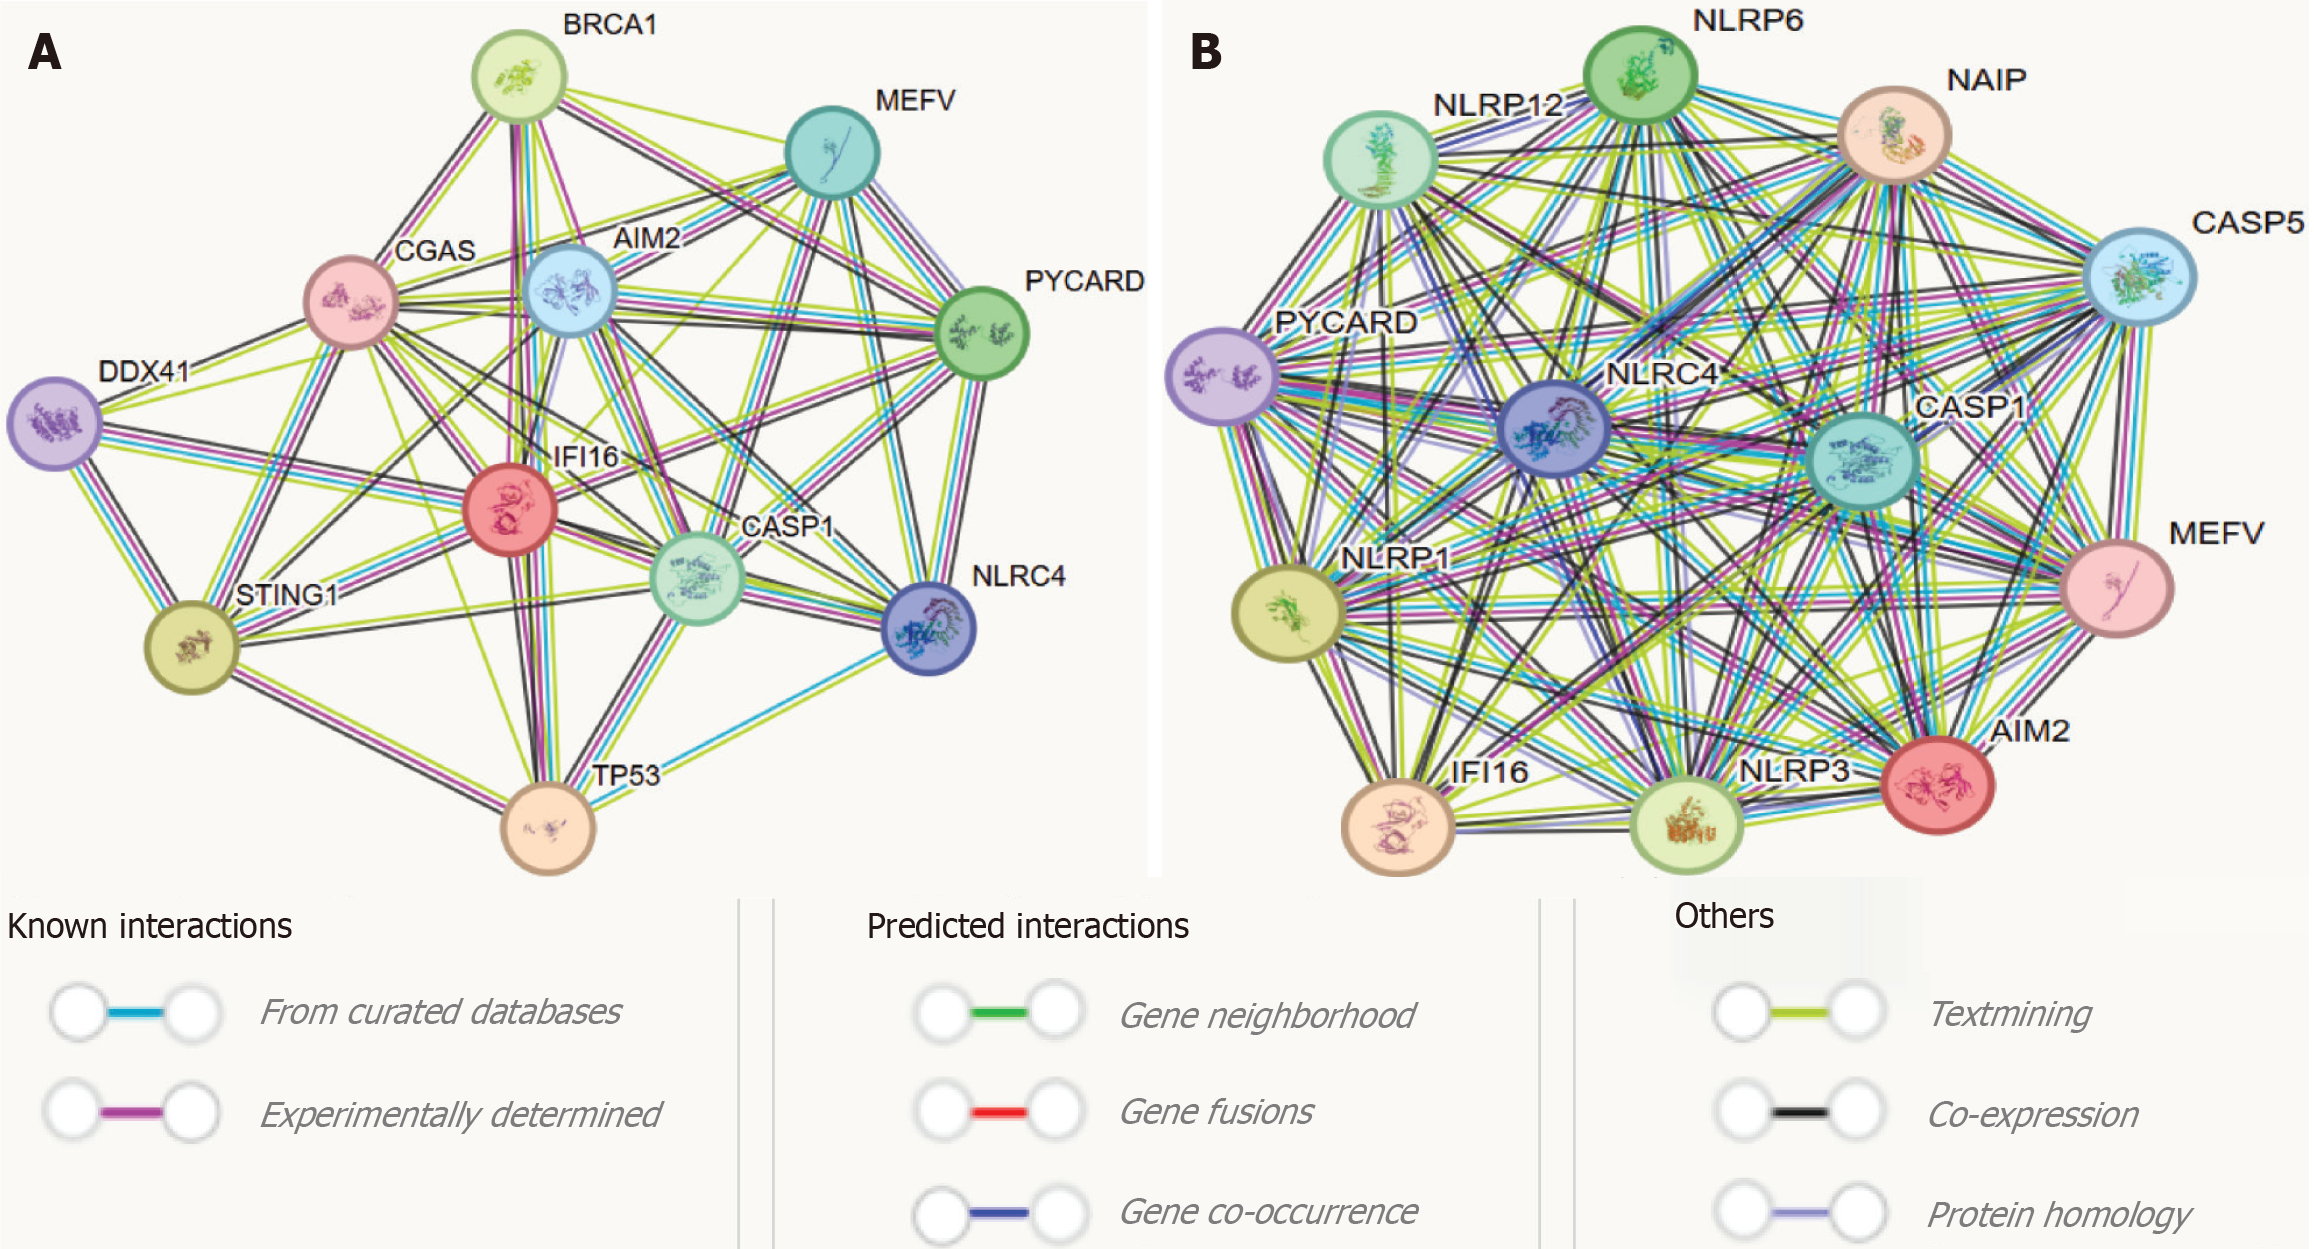
Figure 4 Protein interaction network analysis of IFI16 and AIM2 using STRING online tool.
A: IFI16; B: AIM2. The nodes represent individual protein members of the interaction networks, where a filled node depicts a protein with known/predicted 3D structure), while the dark pink color node in each interaction network shows the query proteins. Meanwhile, the edges and their color correspond to the interaction between proteins and the type of evidence available for a particular interaction (as defined by the legend shown at the bottom of figure).
- Citation: Arshad I, Majid M, Rauff B, Amar A, Choudhery MS. Genetic polymorphism of IFI16 and AIM2 among Pakistani hepatitis C virus-induced fibrosis patients. World J Hepatol 2026; 18(5): 116995
- URL: https://www.wjgnet.com/1948-5182/full/v18/i5/116995.htm
- DOI: https://dx.doi.org/10.4254/wjh.v18.i5.116995