
















Copyright: ©Author(s) 2026.
World J Hepatol. May 27, 2026; 18(5): 116995
Published online May 27, 2026. doi: 10.4254/wjh.v18.i5.116995
Published online May 27, 2026. doi: 10.4254/wjh.v18.i5.116995
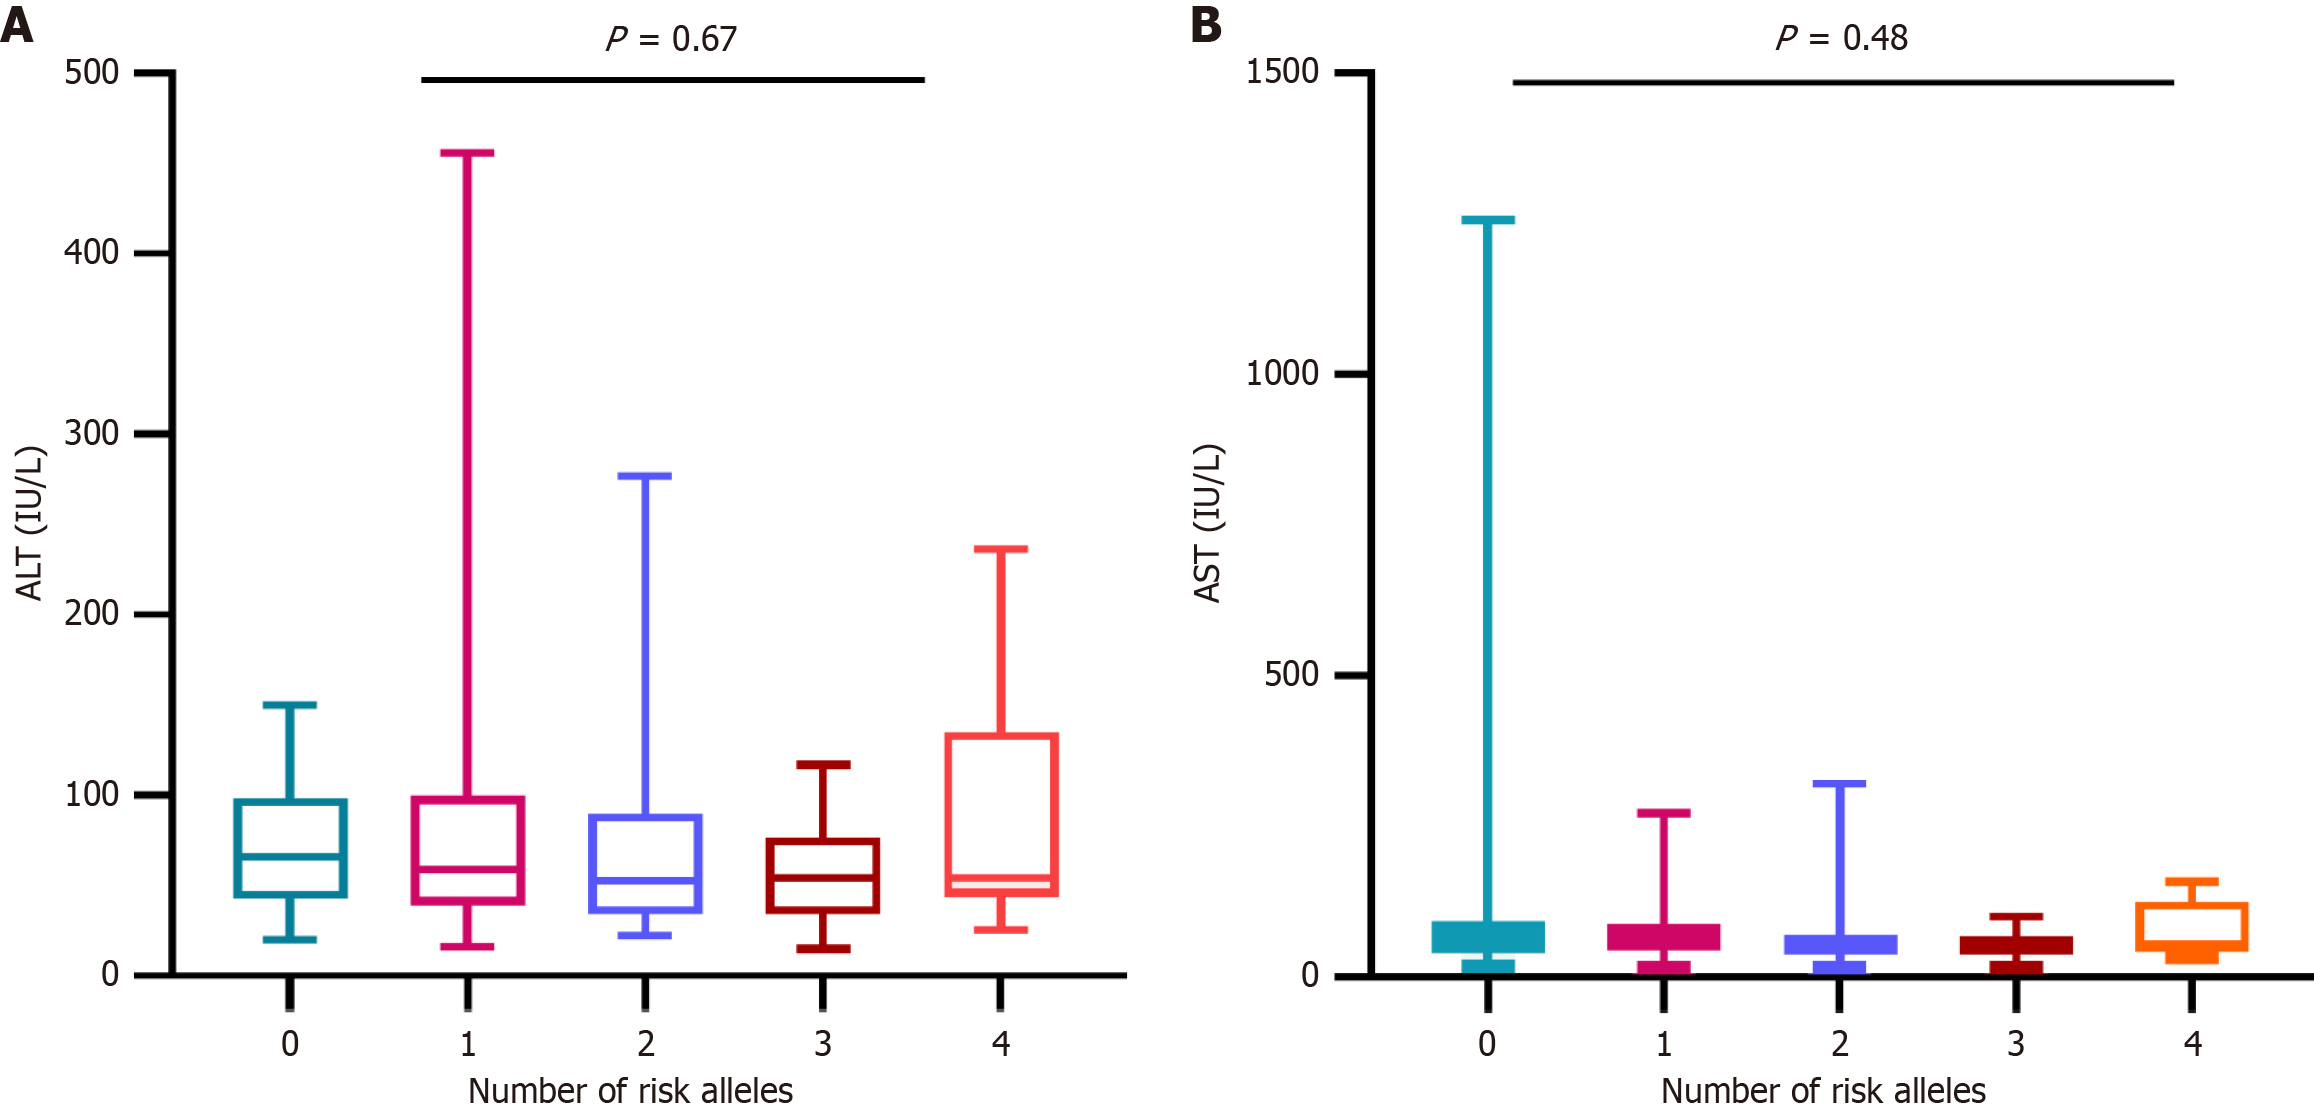
Figure 2 Pooled analysis of IFI16 rs1057028 and AIM2 rs2814770 polymorphisms showing the association between the number of risk alleles and serum liver enzymes.
A and B: The Y-axis represents the alanine aminotransferase (ALT; A) and aspartate aminotransferase (AST) levels (B) while the number of risk alleles at X-axis and the plot data represents the distribution of serum marker levels at each number of risk allele. For ALT, the frequencies of individuals carrying 0, 1, 2, 3, and 4 risk alleles were 25, 52, 22, 28 and 9, respectively. For AST, the frequencies of individuals carrying 0, 1, 2, 3, and 4 risk alleles were 24, 52, 21, 27 and 8, respectively. ALT: Alanine aminotransferase; AST: Aspartate aminotransferase.
- Citation: Arshad I, Majid M, Rauff B, Amar A, Choudhery MS. Genetic polymorphism of IFI16 and AIM2 among Pakistani hepatitis C virus-induced fibrosis patients. World J Hepatol 2026; 18(5): 116995
- URL: https://www.wjgnet.com/1948-5182/full/v18/i5/116995.htm
- DOI: https://dx.doi.org/10.4254/wjh.v18.i5.116995