
















Copyright: ©Author(s) 2026.
World J Hepatol. Apr 27, 2026; 18(4): 118038
Published online Apr 27, 2026. doi: 10.4254/wjh.v18.i4.118038
Published online Apr 27, 2026. doi: 10.4254/wjh.v18.i4.118038
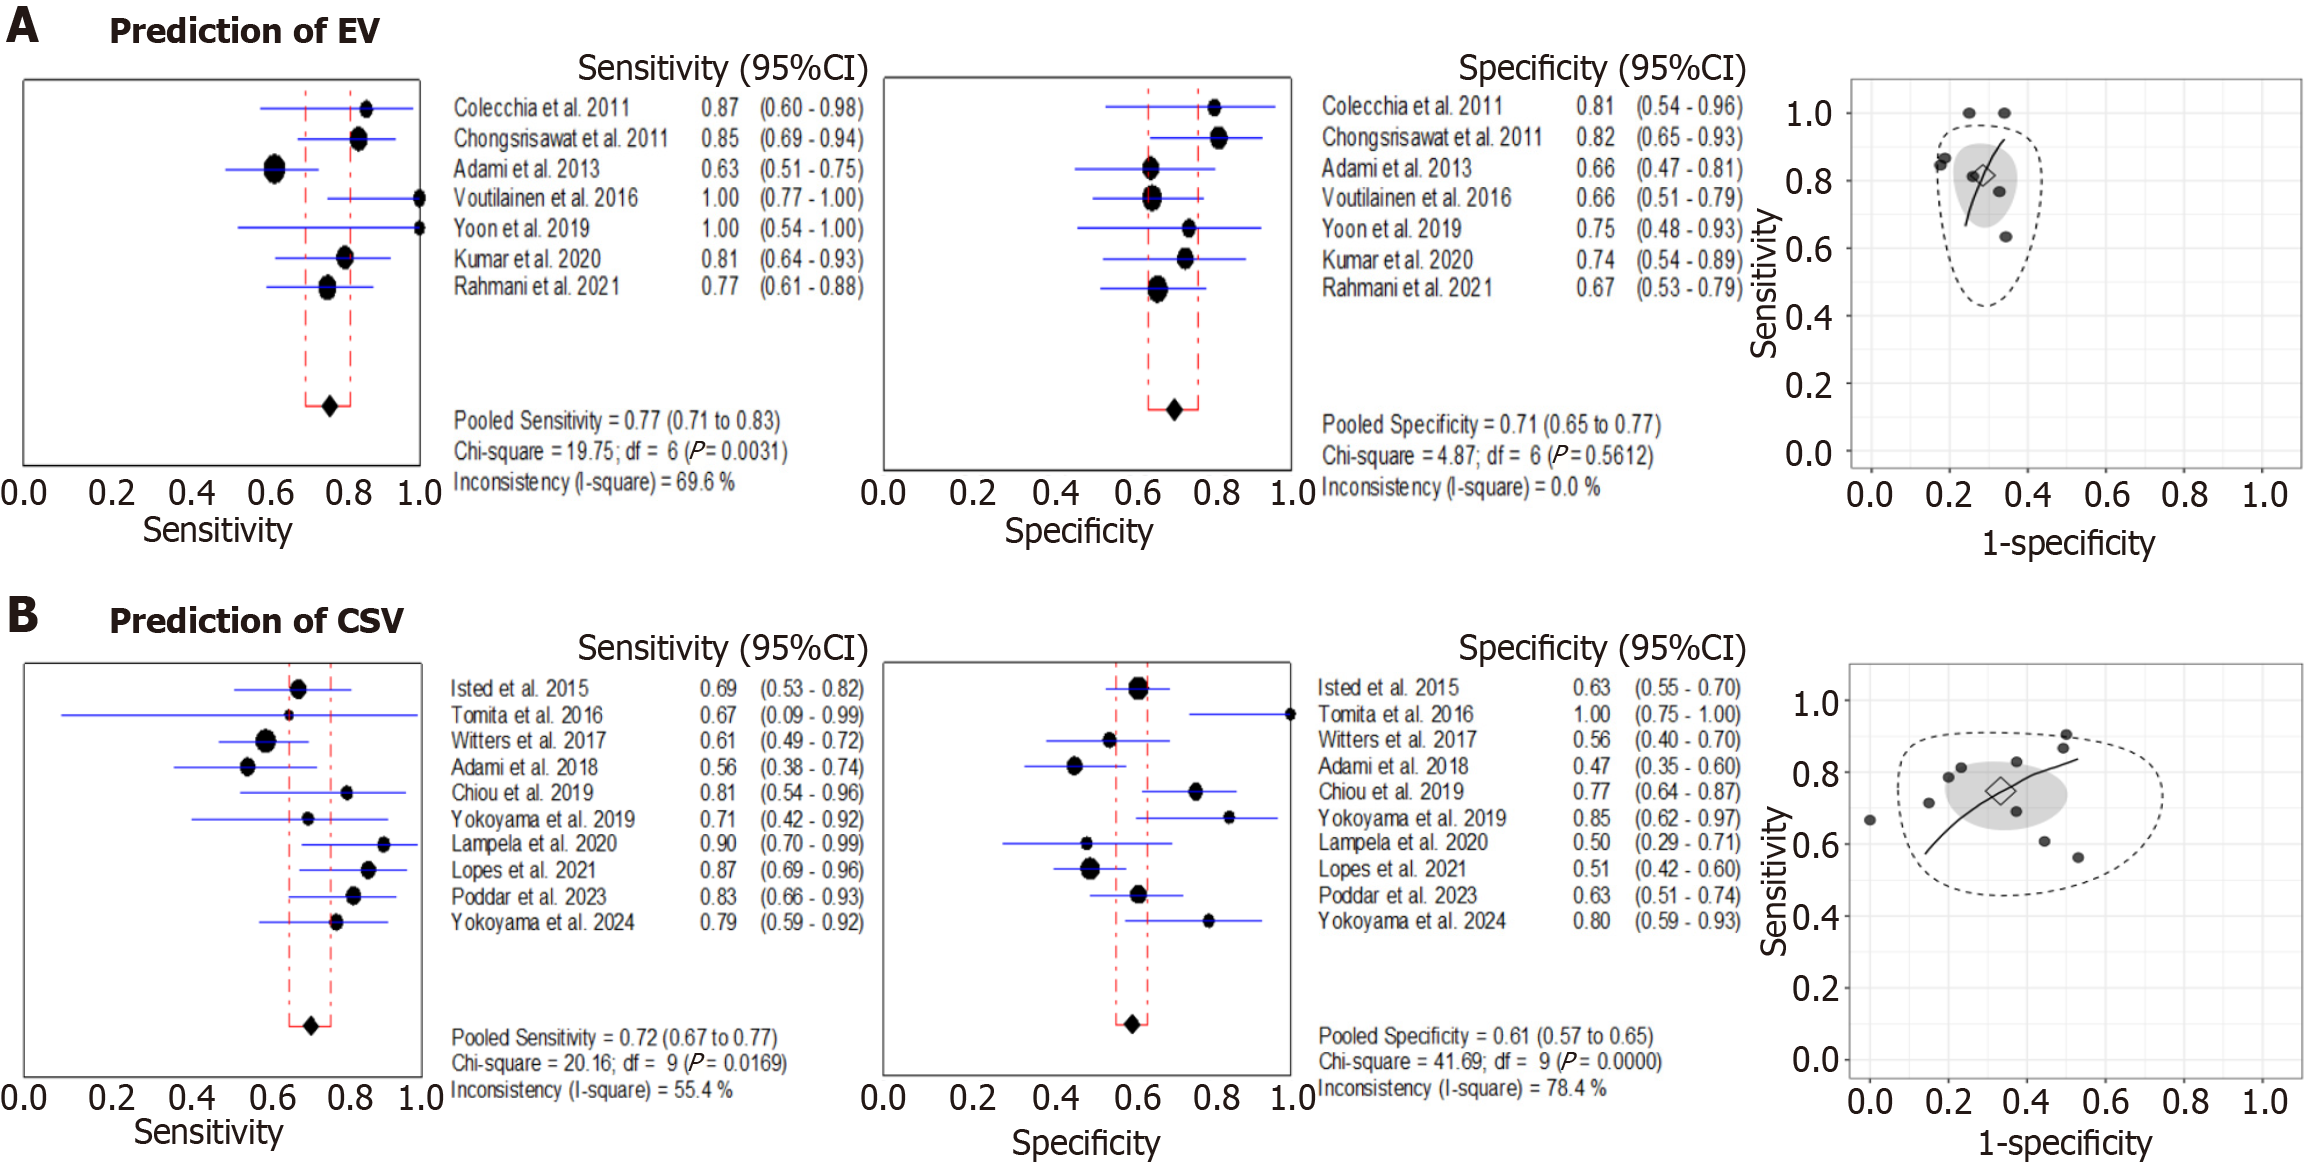
Figure 3 Summary diagnostic accuracy of aminotransferase-to-platelet ratio index for variceal prediction.
A: Forest plot for sensitivity, specificity, and hierarchical summary receiver operating characteristic (HSROC) plot for prediction of esophageal/gastric varices; B: Forest plot for sensitivity, specificity, and HSROC plot for prediction of clinically significant varices. In the HSROC plot, each study is identified with a small black circle. Square denotes the combined sensitivity and specificity, grey shaded area is the 95% confidence region, and the dashed line is the 95% prediction region. EV: Esophageal/gastric varices; CSV: Clinically significant varices.
- Citation: Panda K, Dash DP, Pati GK, Maria A, Gautam V. Diagnostic accuracy of blood-based non-invasive tests for prediction of varices in pediatric portal-hypertension: A systematic review and meta-analysis. World J Hepatol 2026; 18(4): 118038
- URL: https://www.wjgnet.com/1948-5182/full/v18/i4/118038.htm
- DOI: https://dx.doi.org/10.4254/wjh.v18.i4.118038