
















Copyright: ©Author(s) 2026.
World J Hepatol. Apr 27, 2026; 18(4): 117905
Published online Apr 27, 2026. doi: 10.4254/wjh.v18.i4.117905
Published online Apr 27, 2026. doi: 10.4254/wjh.v18.i4.117905
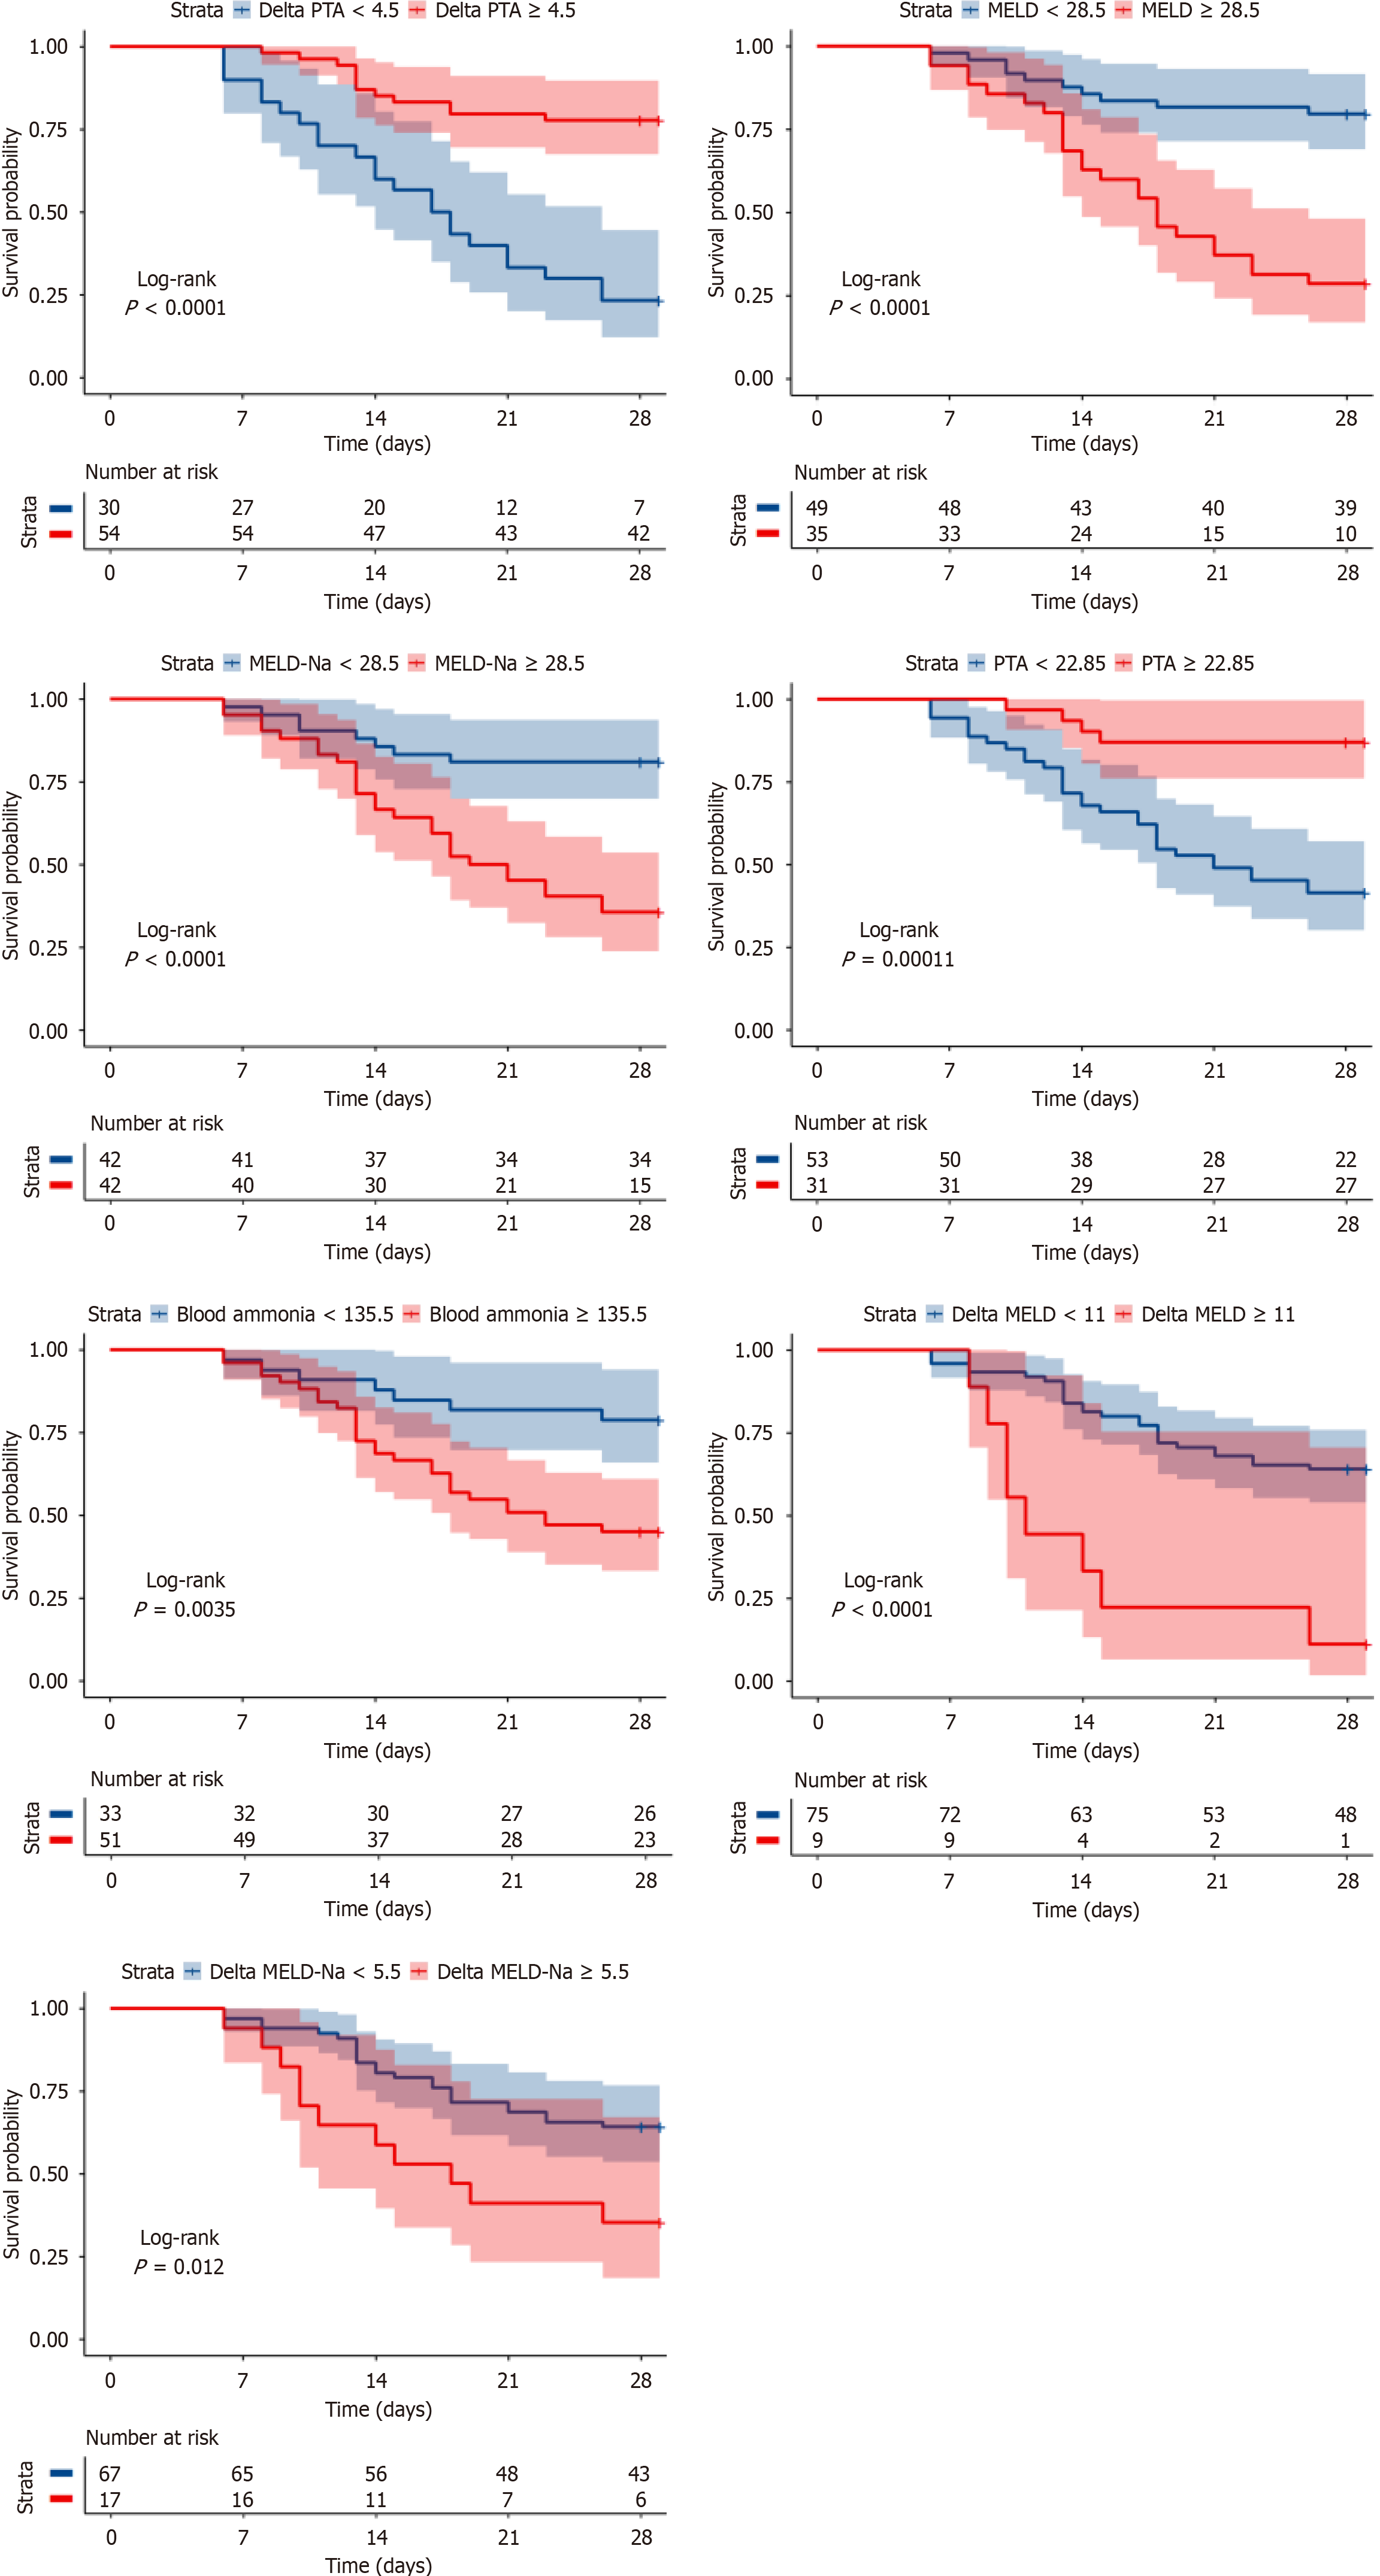
Figure 4 Kaplan-Meier curves showing cumulative survival in the acute liver failure cohort stratified by delta prothrombin activity, model for end-stage liver disease, model for end-stage liver disease-Na, prothrombin activity, blood ammonia, delta model for end-stage liver disease, and delta model for end-stage liver disease-Na.
Significance was estimated using the log-rank test. PTA: Prothrombin activity; MELD: Model for end-stage liver disease.
- Citation: He YL, Yin XH, Xu XT, Li J, Meng QH. Glucocorticoid therapy in acute liver failure: Survival outcomes, predictors, and a response prediction model. World J Hepatol 2026; 18(4): 117905
- URL: https://www.wjgnet.com/1948-5182/full/v18/i4/117905.htm
- DOI: https://dx.doi.org/10.4254/wjh.v18.i4.117905