
















Copyright: ©Author(s) 2026.
World J Hepatol. Apr 27, 2026; 18(4): 116153
Published online Apr 27, 2026. doi: 10.4254/wjh.v18.i4.116153
Published online Apr 27, 2026. doi: 10.4254/wjh.v18.i4.116153
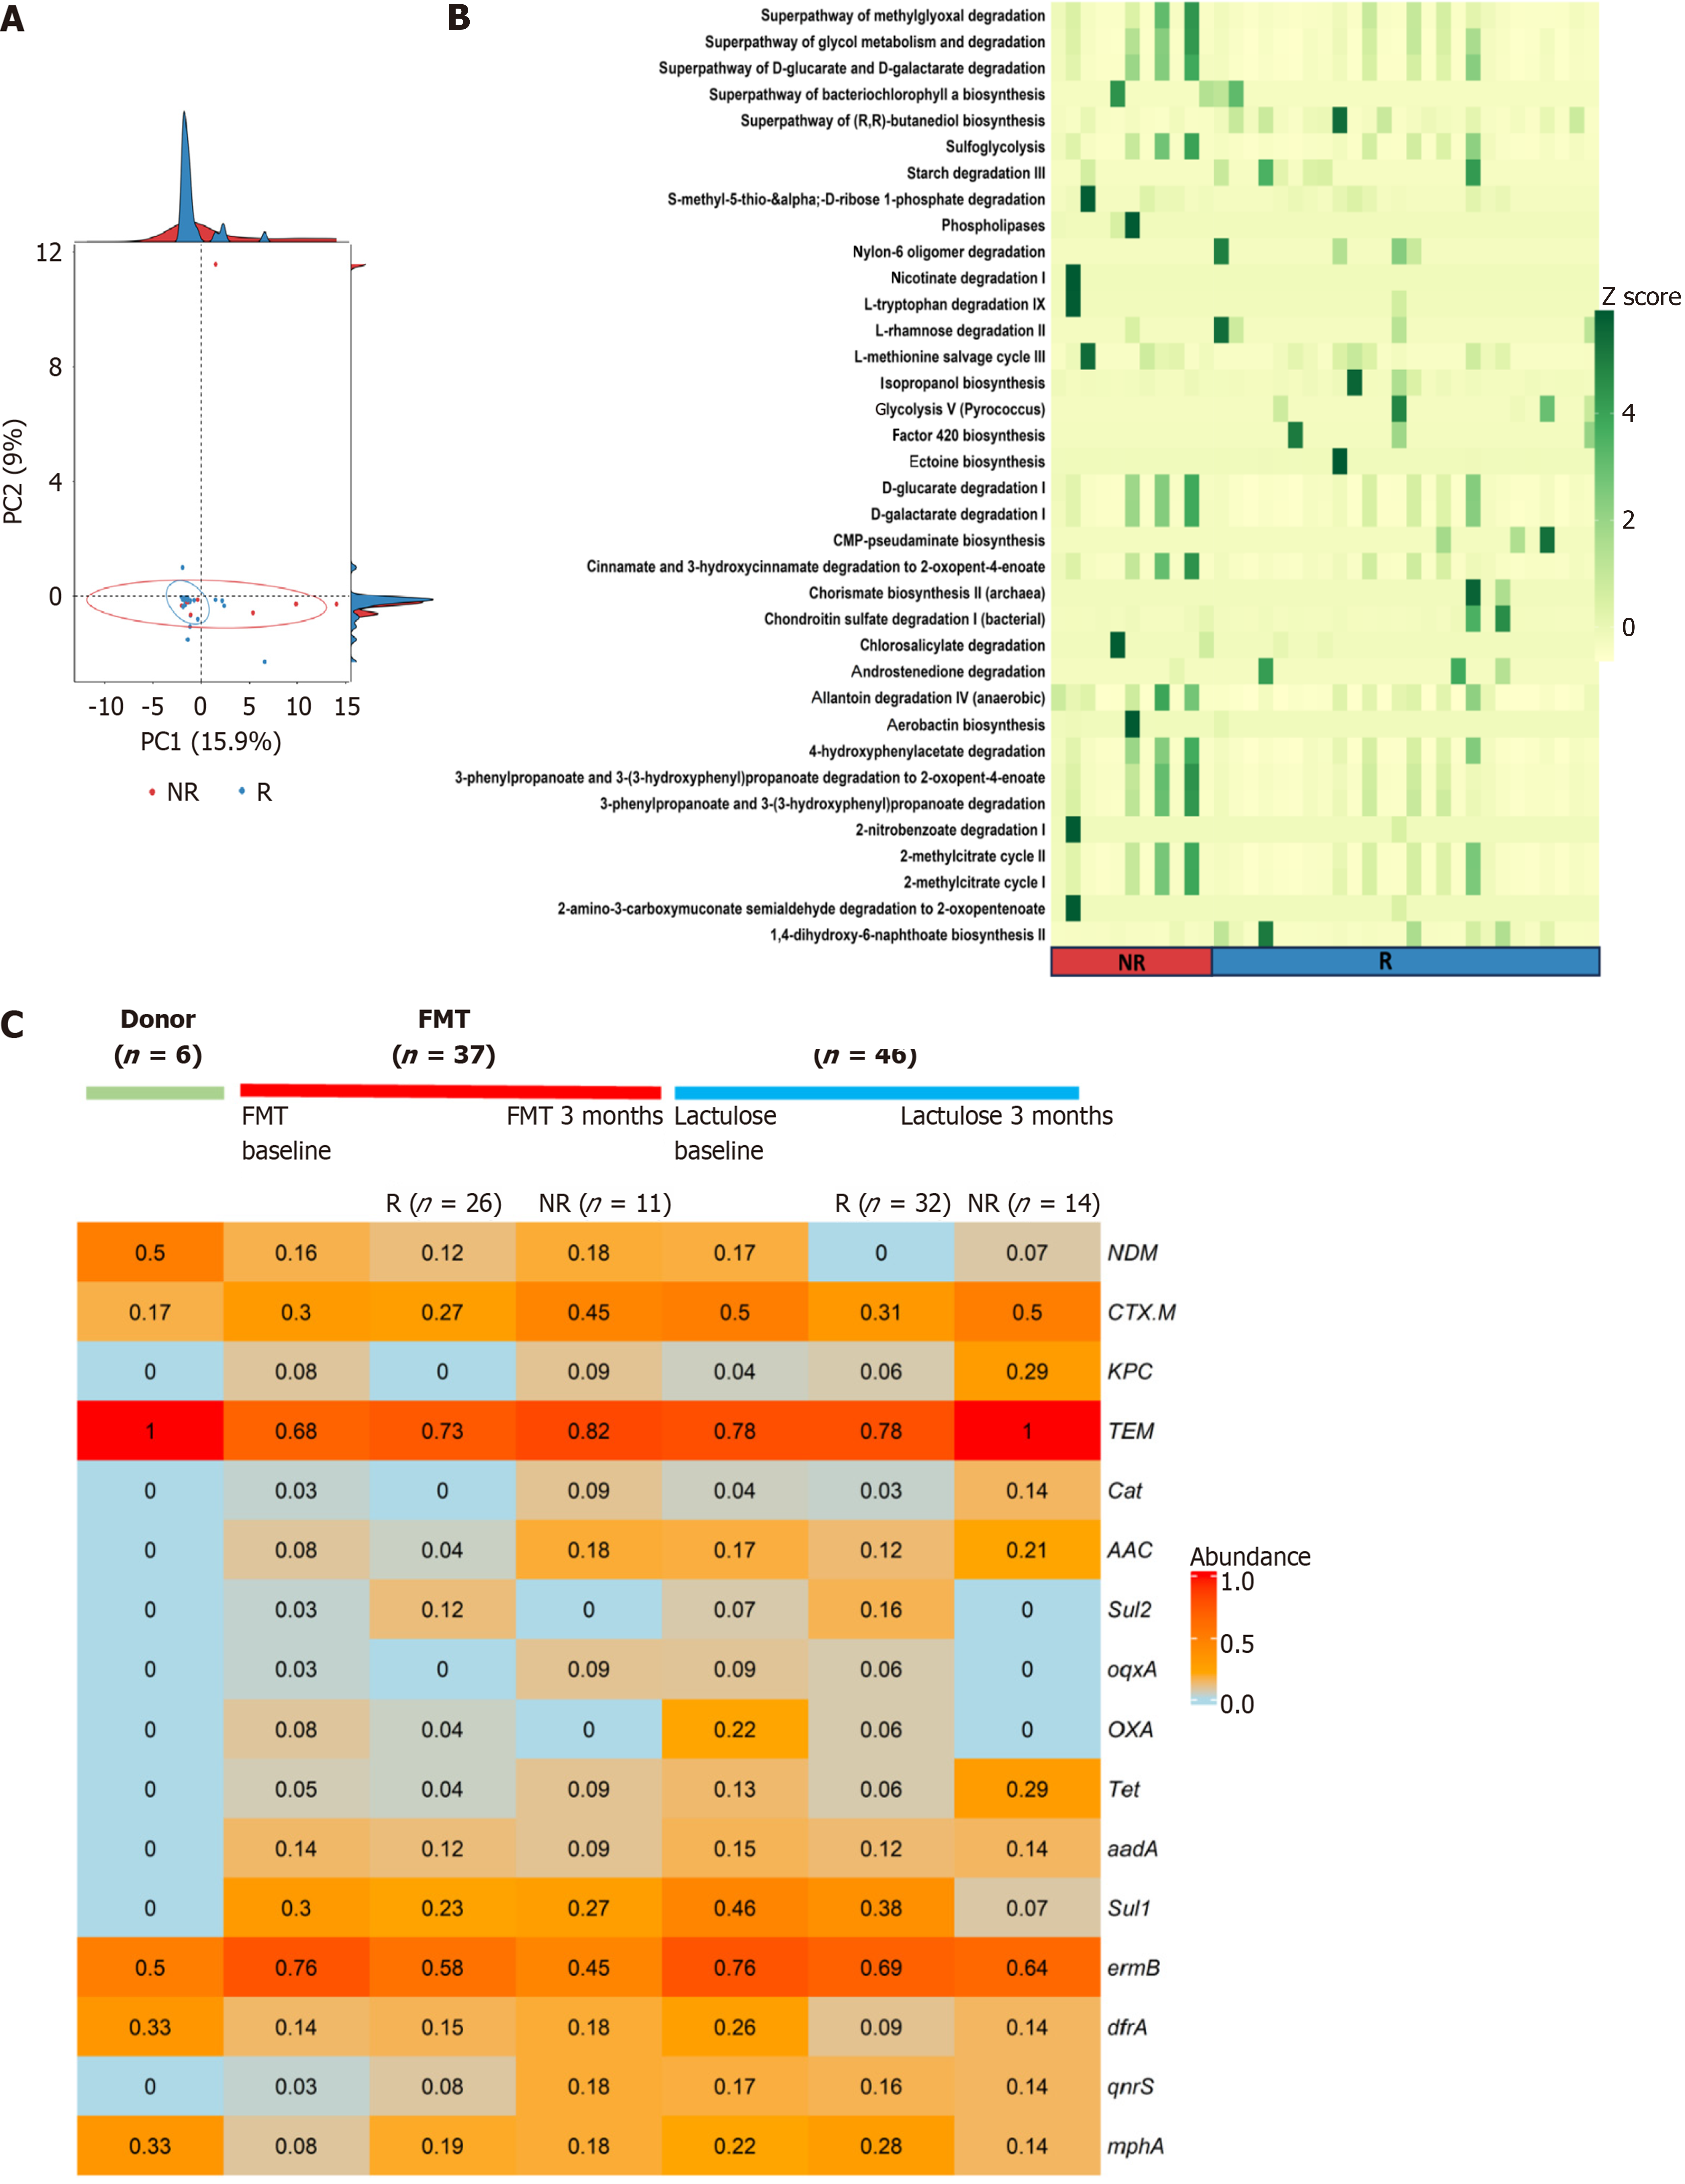
Figure 4 Functional analysis of minimal hepatic encephalopathy responders and non-responders in the fecal microbiota transplantation group.
A and B: Differential abundance analysis using edgeR (P-adjusted < 0.05). Principal component analysis plot comparing minimal hepatic encephalopathy responders (R) and non-responders (NR) (A). Heatmap displaying the 36 differentially enriched metabolic pathways between R and NR, represented by Z scores (B); C: Heatmap showing the proportion of individuals testing positive for antimicrobial resistance genes among donors, baseline (fecal microbiota transplantation and lactulose), after 3 months (R and NR) for both fecal microbiota transplantation and lactulose. The Y-axis represents the different antimicrobial resistance genes, and the X-axis represents the various groups. R: Responders; NR: Non-responders; PC: Principal component; FMT: Fecal microbiota transplantation; NDM: New Delhi metallo-β-lactamase; CTX.M: Cefotaxime-Munich; KPC: Klebsiella pneumoniae carbapenemase; TEM: Temoniera; Cat:; AAC: Aminoglycoside acetyltransferase; Sul2: Sulfonamide-resistant dihydropteroate synthase 2; oqxa: Olaquindox resistance efflux pump subunit A; OXA: Oxacillinase; Tet: Tetracycline resistance gene/protei; aadA: Aminoglycoside adenylyltransferase A; sul1: Sulfonamide-resistant dihydropteroate synthase 1; ermB: Erythromycin ribosome methylase B; dfrA: Dihydrofolate reductase A; qnrS: Quinolone resistance gene S; mphA: Macrolide phosphotransferase A.
- Citation: Agarwal A, Agrawal S, Talukdar D, Kaur M, Biswas S, Swaroop S, Golla R, Kandiyal B, Jana P, Tanwar S, Aggarwal A, Singh HC, Agarwal A, Mahajan M, Tiwari B, Nayak B, Goel A, Das B, Shalimar. Impact of two-session fecal microbiota transplantation on minimal hepatic encephalopathy in cirrhosis. World J Hepatol 2026; 18(4): 116153
- URL: https://www.wjgnet.com/1948-5182/full/v18/i4/116153.htm
- DOI: https://dx.doi.org/10.4254/wjh.v18.i4.116153