
















Copyright: ©Author(s) 2026.
World J Hepatol. Apr 27, 2026; 18(4): 116153
Published online Apr 27, 2026. doi: 10.4254/wjh.v18.i4.116153
Published online Apr 27, 2026. doi: 10.4254/wjh.v18.i4.116153
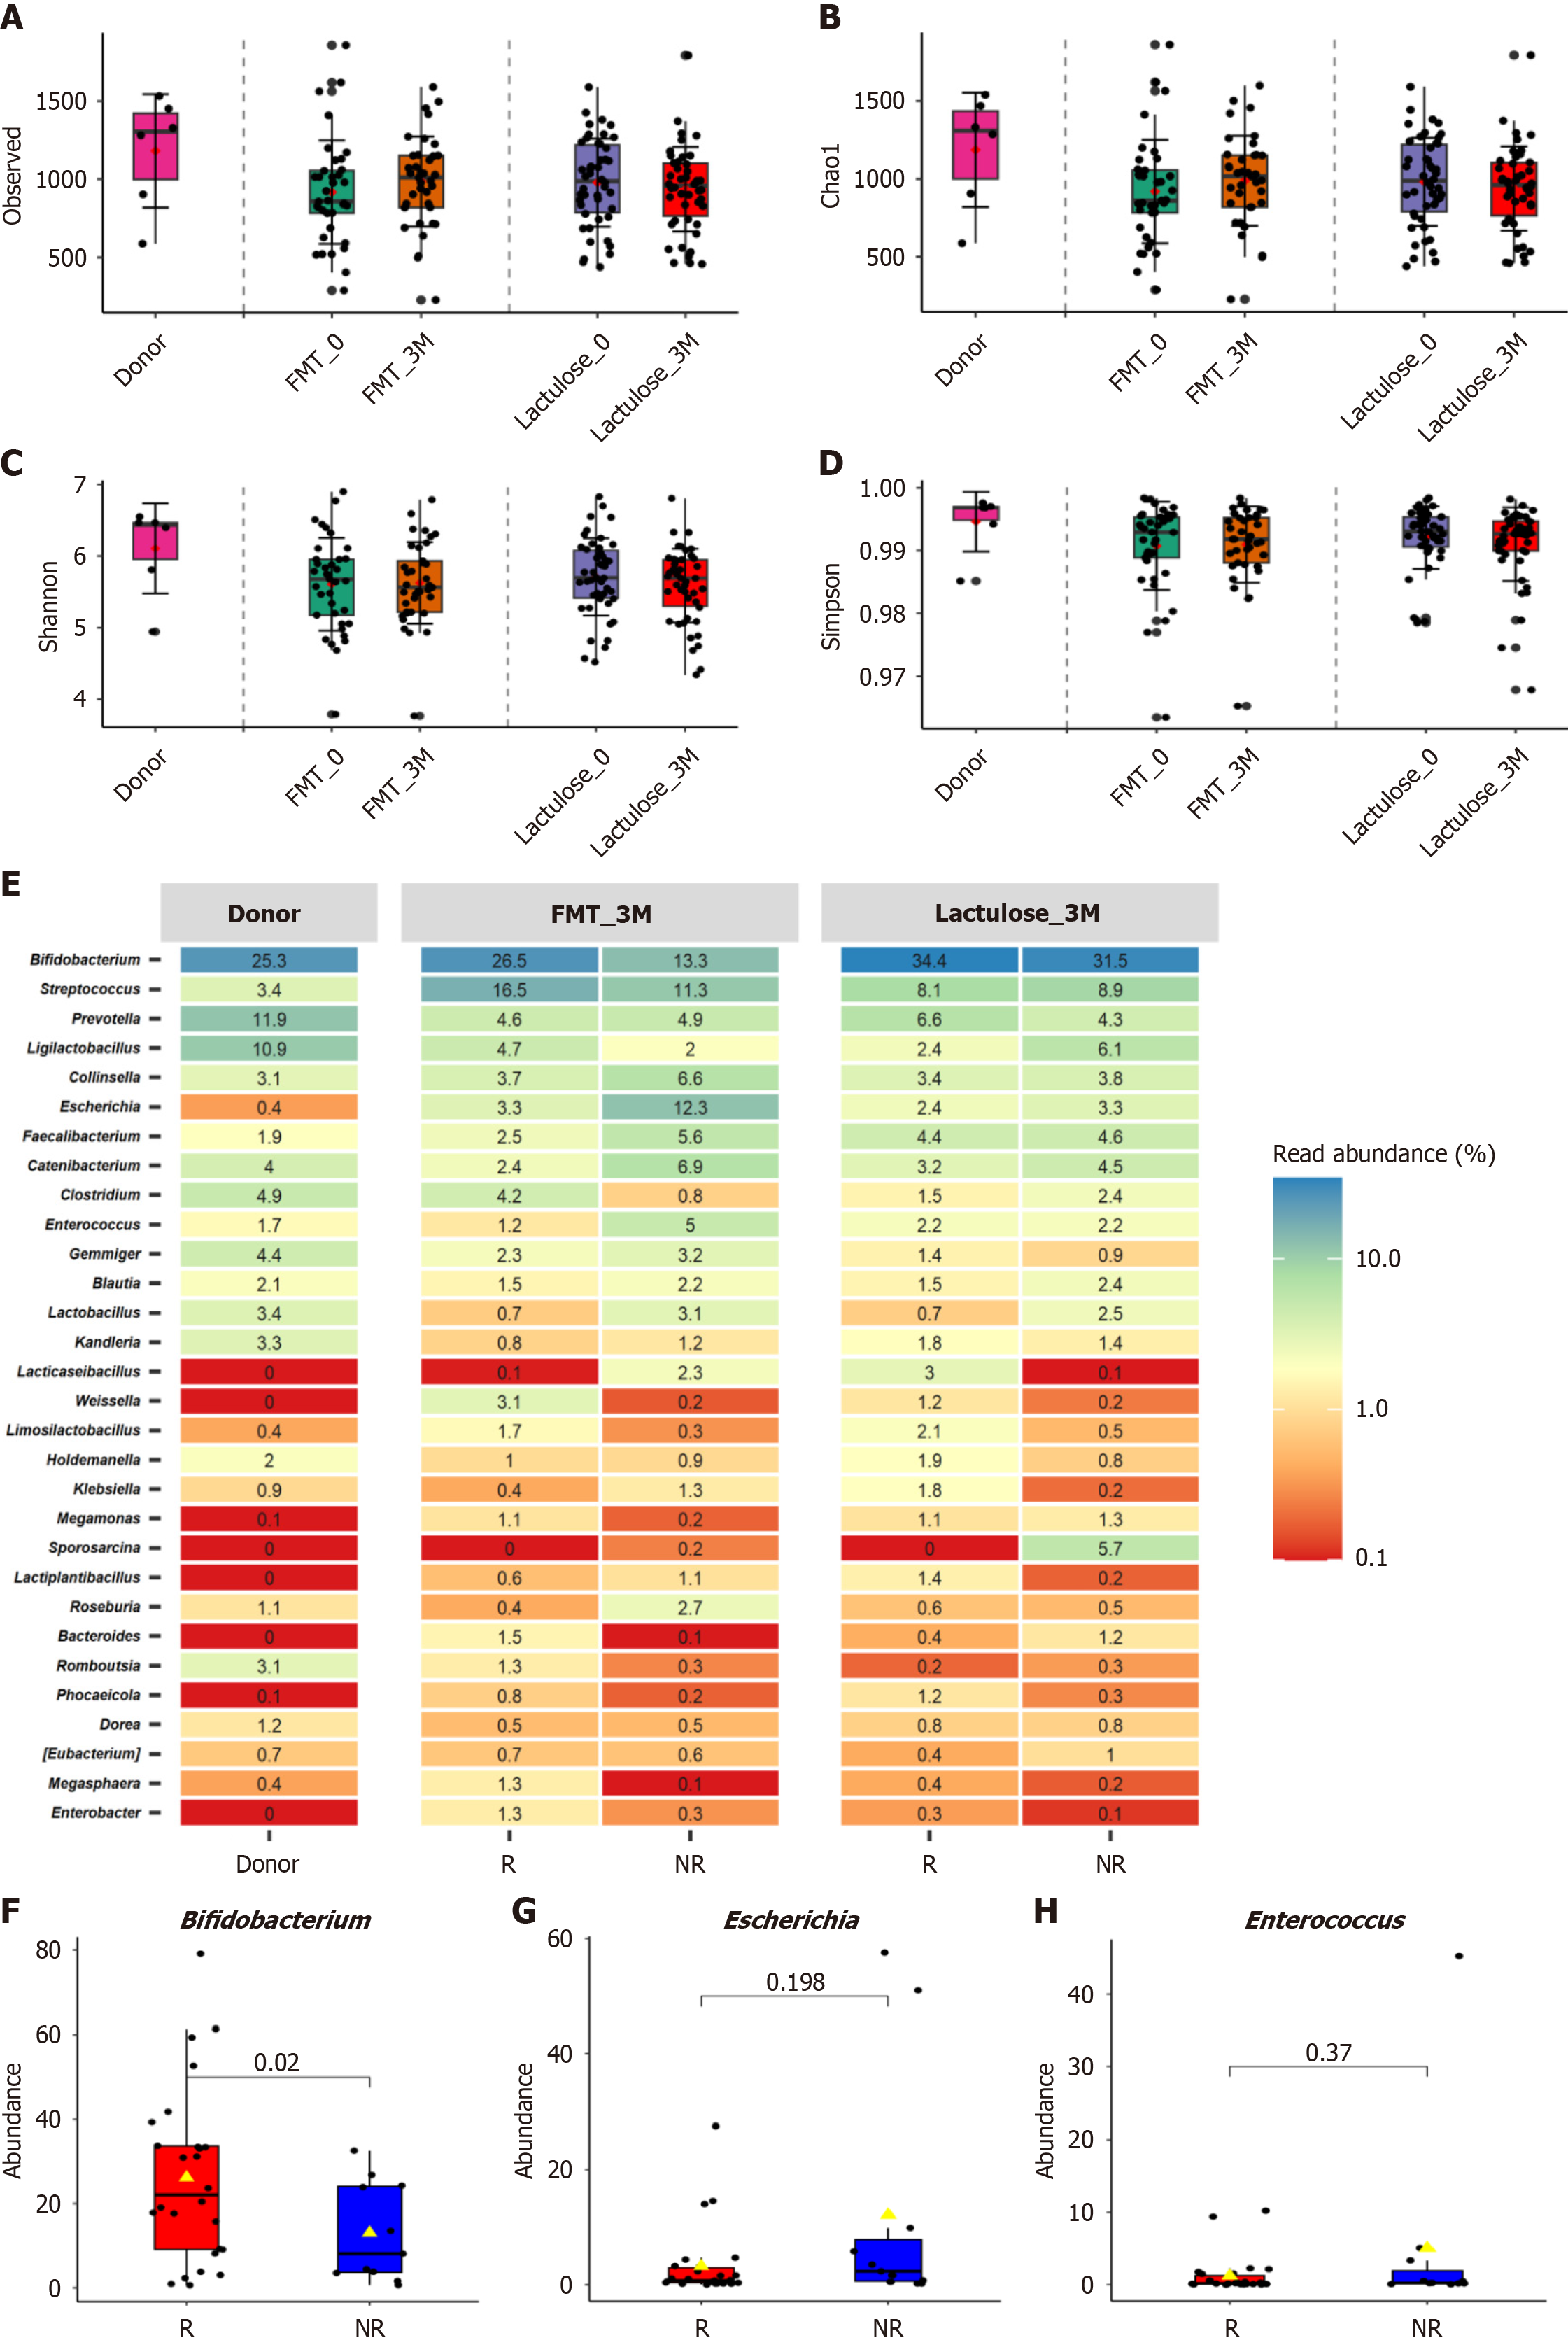
Figure 3 Alpha diversity and taxonomic abundance comparisons in donors, fecal microbiota transplantation, and lactulose groups.
A-D: Alpha diversity metrics (Observed, Chao1, Shannon, and Simpson indices) comparing microbiota diversity across different groups: Donor, fecal microbiota transplantation (FMT) baseline, after 3 months (n = 37), lactulose baseline, and after 3 months (n = 46). The Boxplots show the median, interquartile range, and individual data points (differences among groups, P > 0.05, Tukey-HSD test, non-parametric test); E: A heat map illustrating taxonomic abundance and comparisons among donors, minimal hepatic encephalopathy responders, and non-responders in the FMT and Lactulose groups after 3 months; F-H: Box plots showing the mean relative abundance of (%) of Bifidobacterium (P = 0.02, t-test), Escherichia (P = 0.20, t-test), and Enterococcus (P = 0.37, t-test) between responders and non-responders after 3 months in FMT group. FMT_0: Fecal microbiota transplantation baseline; FMT_3M: Fecal microbiota transplantation after 3 months; Lactulose_0: Lactulose baseline; Lactulose_3M: Lactulose after 3 months; R: Responders; NR: Non-responders.
- Citation: Agarwal A, Agrawal S, Talukdar D, Kaur M, Biswas S, Swaroop S, Golla R, Kandiyal B, Jana P, Tanwar S, Aggarwal A, Singh HC, Agarwal A, Mahajan M, Tiwari B, Nayak B, Goel A, Das B, Shalimar. Impact of two-session fecal microbiota transplantation on minimal hepatic encephalopathy in cirrhosis. World J Hepatol 2026; 18(4): 116153
- URL: https://www.wjgnet.com/1948-5182/full/v18/i4/116153.htm
- DOI: https://dx.doi.org/10.4254/wjh.v18.i4.116153