
















Copyright: ©Author(s) 2026.
World J Hepatol. Apr 27, 2026; 18(4): 114804
Published online Apr 27, 2026. doi: 10.4254/wjh.v18.i4.114804
Published online Apr 27, 2026. doi: 10.4254/wjh.v18.i4.114804
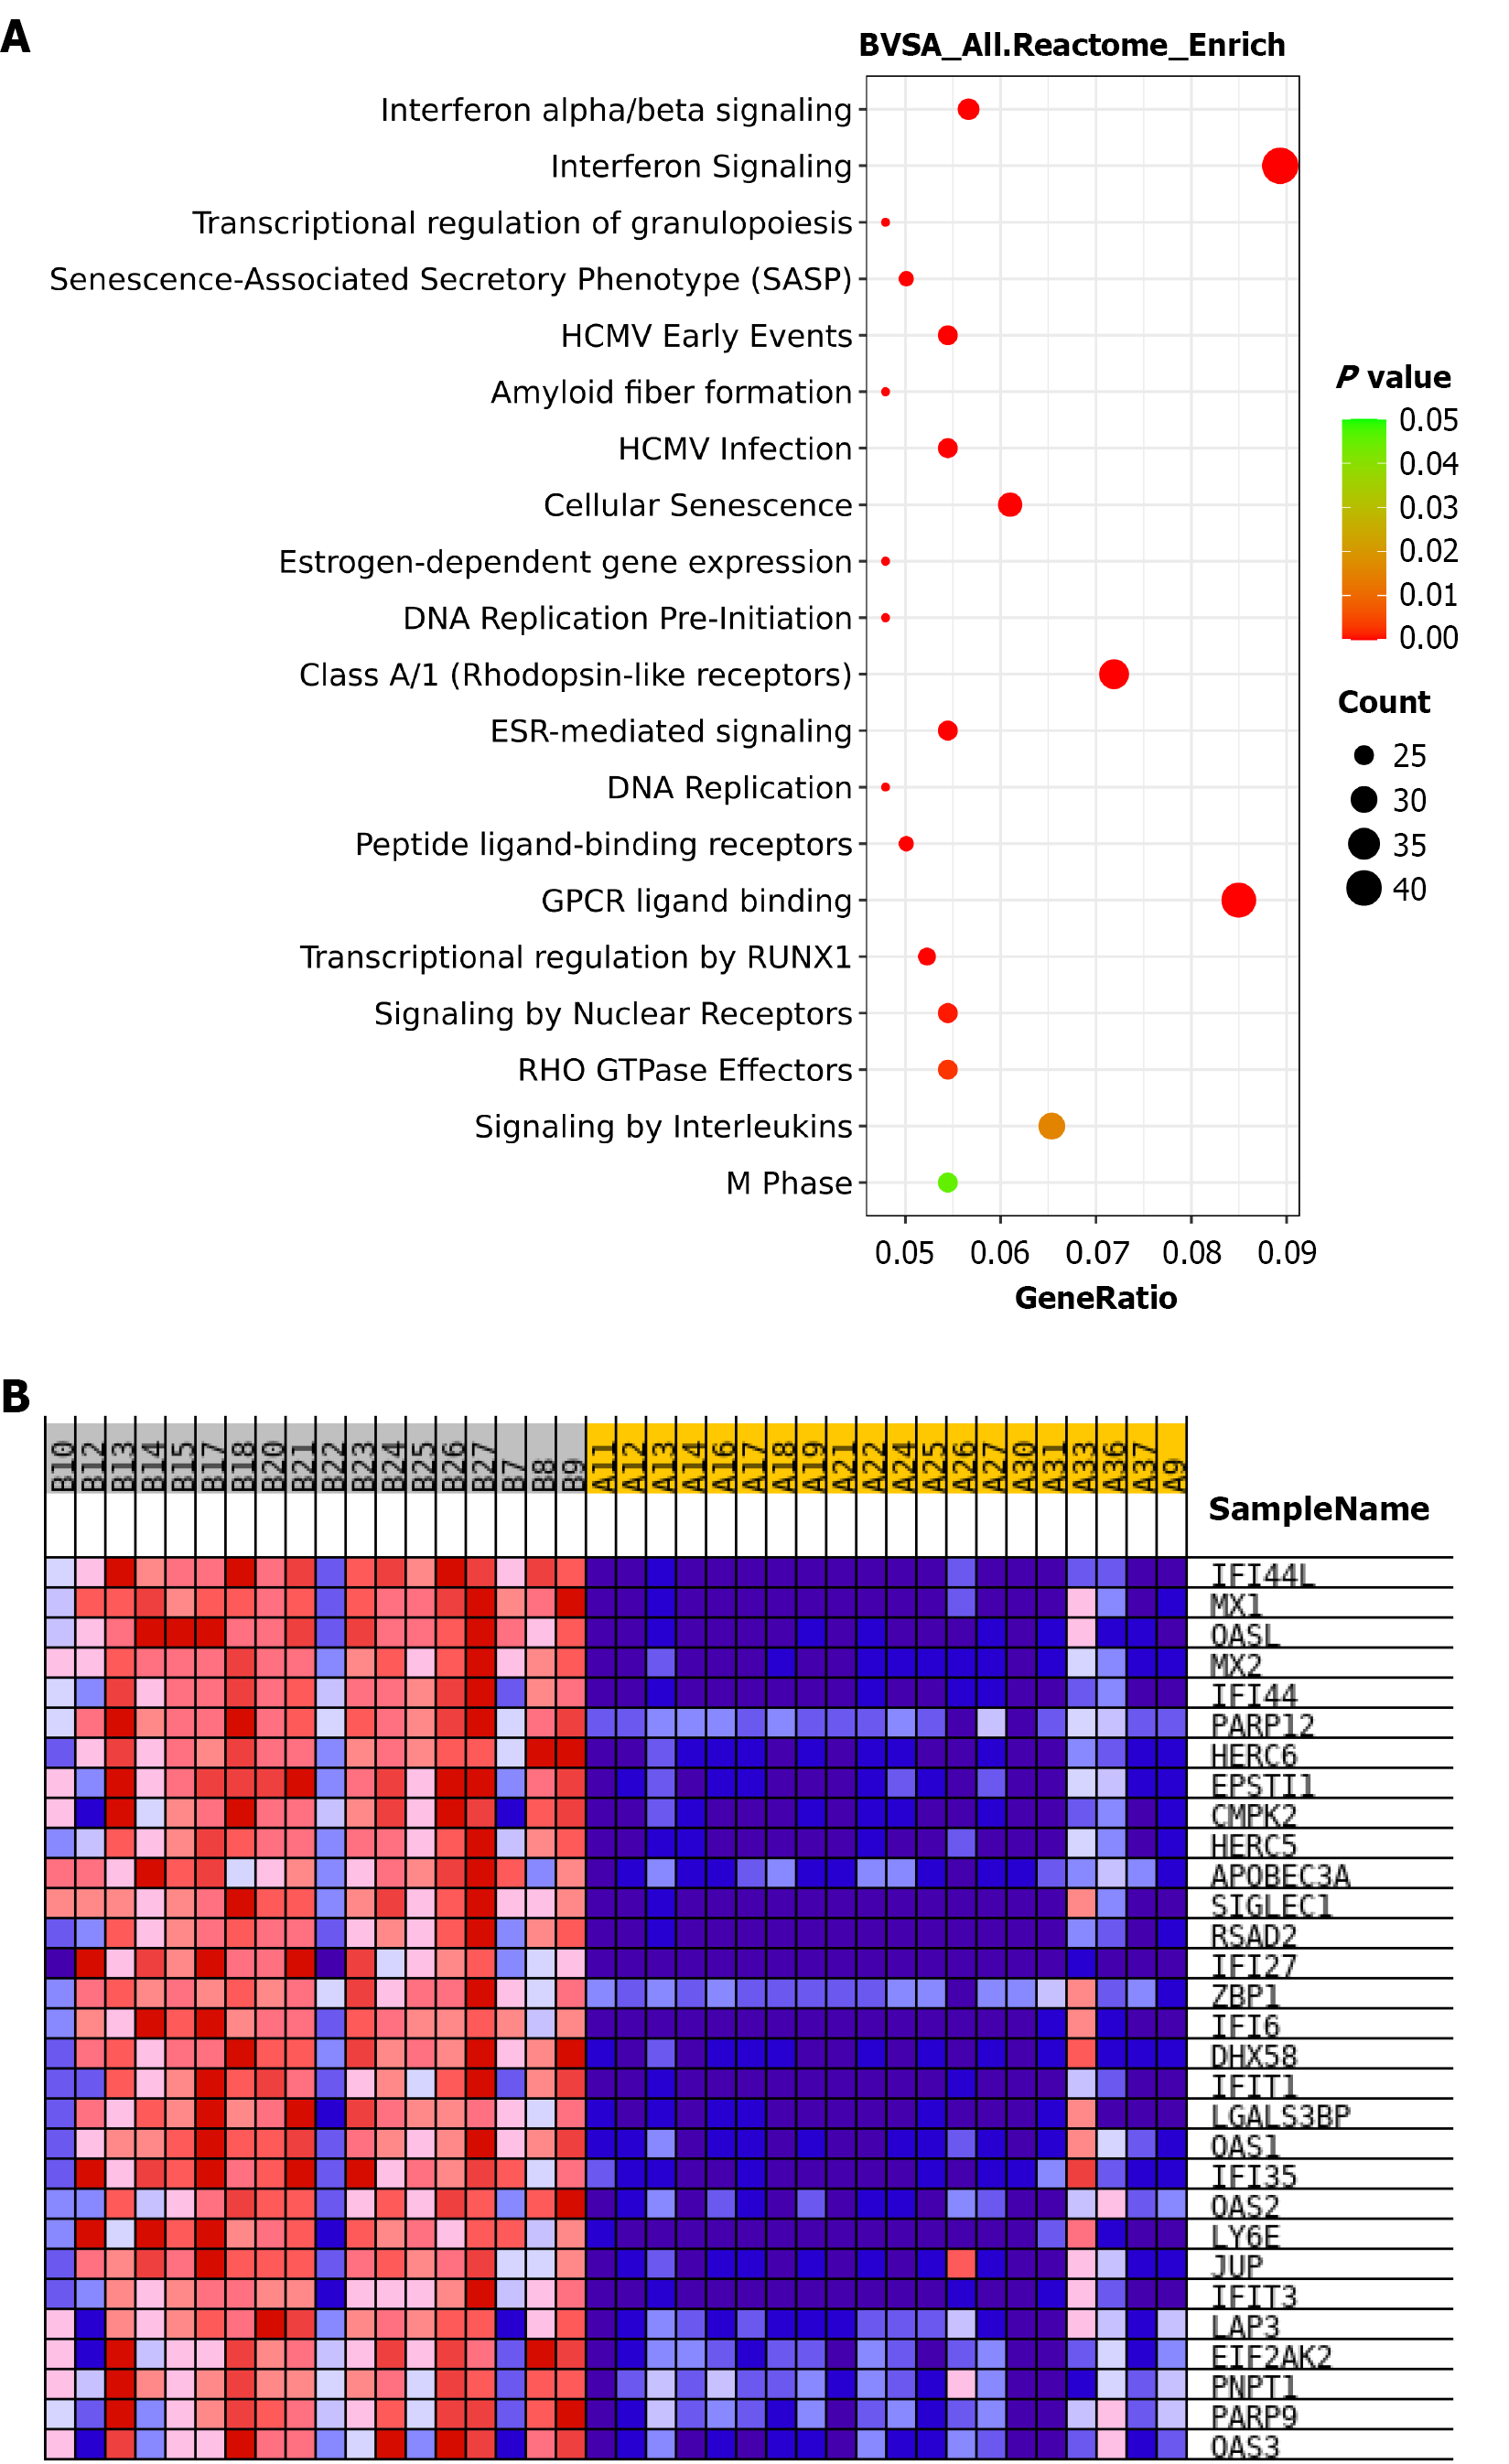
Figure 3 Kyoto Encyclopedia of Genes and Genomes enrichment analysis of differentially expressed genes after interferon treatment.
A: Rectangular tree diagram showing the top enriched differentially expressed genes pathways in the B vs A group; B: Heatmap of differentially expressed genes in the “IFNbeta targets” gene set, based on gene set enrichment analysis for the B vs A group.
- Citation: Ye XY, He XZ, Hu ZT, Zheng FF, Huang XG, Xie XM, Chen FH, Ou HB, Qiu RX. Integrated transcriptomics and metabolomics reveal neutrophil extracellular trap associated with interferon treatment for chronic hepatitis B. World J Hepatol 2026; 18(4): 114804
- URL: https://www.wjgnet.com/1948-5182/full/v18/i4/114804.htm
- DOI: https://dx.doi.org/10.4254/wjh.v18.i4.114804